Newton meets AI
View Sequence overviewStudents will:
- understand that total stopping distance = reaction distance + stopping distance.
- use a computer model to test how starting speed affects the total stopping distance of a car.
- use a computer model to test other factors (tyres, road surface, or weather) that affect the stopping distance of a car.
Students will represent their understanding as they:
- plan and conduct an experiment that examines factors that affect the stopping distance of a car.
- analyse the results and draw conclusions of an experiment that examines factors that affect the stopping distance of a car.
- use argumentation to provide advice to an autonomous car manufacturer related to how the car should drive on different road surfaces, weather, or worn tyres.
In this lesson, assessment is formative.
Feedback might focus on:
- students’ ability to quantitatively analyse the relationship between speed, distance and acceleration.
- students’ ability to plan and conduct an experiment.
- students’ ability to process and analyse data.
- students’ ability to evaluate the validity of a claim or argument.
Potential summative assessment
Students working at the achievement standard should:
- investigate a moving object to analyse and propose relationships between distance, speed and acceleration.
- plan and conduct safe, valid and reproducible investigations to test relationships.
- select equipment and use it efficiently to generate and record appropriate sample sizes and replicable data with precision.
- select and construct effective representations to organise, process and summarise data and information.
- analyse data to identify and explain patterns.
- evaluate the validity and reproducibility of methods and the validity of claims.
- construct logical arguments based on analysis of evidence to support conclusions and evaluate claims.
Refer to the Australian Curriculum content links on the Our design decisions tab for further information.
Whole class
Newton meets AI Resource PowerPoint
Video: Eddie Woo discusses stopping distances and speed (2:05)
Each student
Individual science notebook
Access to It’s a drag website interactive
Braking distance Resource sheet
Lesson
Re-orient
Discuss the time it takes to start braking (the reaction time) when driving a car. Recall the type of distractions that a car driver might experience and how this could impact their driving time.
Discuss the distraction that had the biggest impact on the reaction time and the impact it had on the stopping distance (calculated from the area under the graph).
The Inquire phase allows students to cycle progressively and with increasing complexity through the key science ideas related to the core concepts. Each Inquire cycle is divided into three teaching and learning routines that allow students to systematically build their knowledge and skills in science and incorporate this into their current understanding of the world.
When designing a teaching sequence, it is important to consider the knowledge and skills that students will need in the final Act phase. Consider what the students already know and identify the steps that need to be taken to reach the level required. How could you facilitate students’ understanding at each step? What investigations could be designed to build the skills at each step?
Read more about using the LIA FrameworkIdentifying and constructing questions is the creative driver of the inquiry process. It allows students to explore what they know and how they know it. During the Inquire phase of the LIA Framework, the Question routine allows for past activities to be reviewed and to set the scene for the investigation that students will undertake. The use of effective questioning techniques can influence students’ view and interpretation of upcoming content, open them to exploration and link to their current interests and science capital.
When designing a teaching sequence, it is important to spend some time considering the mindset of students at the start of each Inquire phase. What do you want students to be thinking about, what do they already know and what is the best way for them to approach the task? What might tap into their curiosity?
Read more about using the LIA FrameworkWhat happens when we brake?
Pose the question: What factors could affect how quickly the brakes slow you down?
(Slide 36) Brainstorm all the factors that could affect the effectiveness of the brakes, including the speed of the car, tire wear, type of road surface, and weather conditions.
Pose the question: How would these factors affect the ability of a car to brake?
The Inquire phase allows students to cycle progressively and with increasing complexity through the key science ideas related to the core concepts. Each Inquire cycle is divided into three teaching and learning routines that allow students to systematically build their knowledge and skills in science and incorporate this into their current understanding of the world.
When designing a teaching sequence, it is important to consider the knowledge and skills that students will need in the final Act phase. Consider what the students already know and identify the steps that need to be taken to reach the level required. How could you facilitate students’ understanding at each step? What investigations could be designed to build the skills at each step?
Read more about using the LIA FrameworkThe Investigate routine provides students with an opportunity to explore the key ideas of science, to plan and conduct an investigation, and to gather and record data. The investigations are designed to systematically develop content knowledge and skills through increasingly complex processes of structured inquiry, guided inquiry and open inquiry approaches. Students are encouraged to process data to identify trends and patterns and link them to the real-world context of the teaching sequence.
When designing a teaching sequence, consider the diagnostic assessment (Launch phase) that identified the alternative conceptions that students held. Are there activities that challenge these ideas and provide openings for discussion? What content knowledge and skills do students need to be able to complete the final (Act phase) task? How could you systematically build these through the investigation routines? Are there opportunities to build students’ understanding and skills in the science inquiry processes through the successive investigations?
Read more about using the LIA FrameworkBraking distance
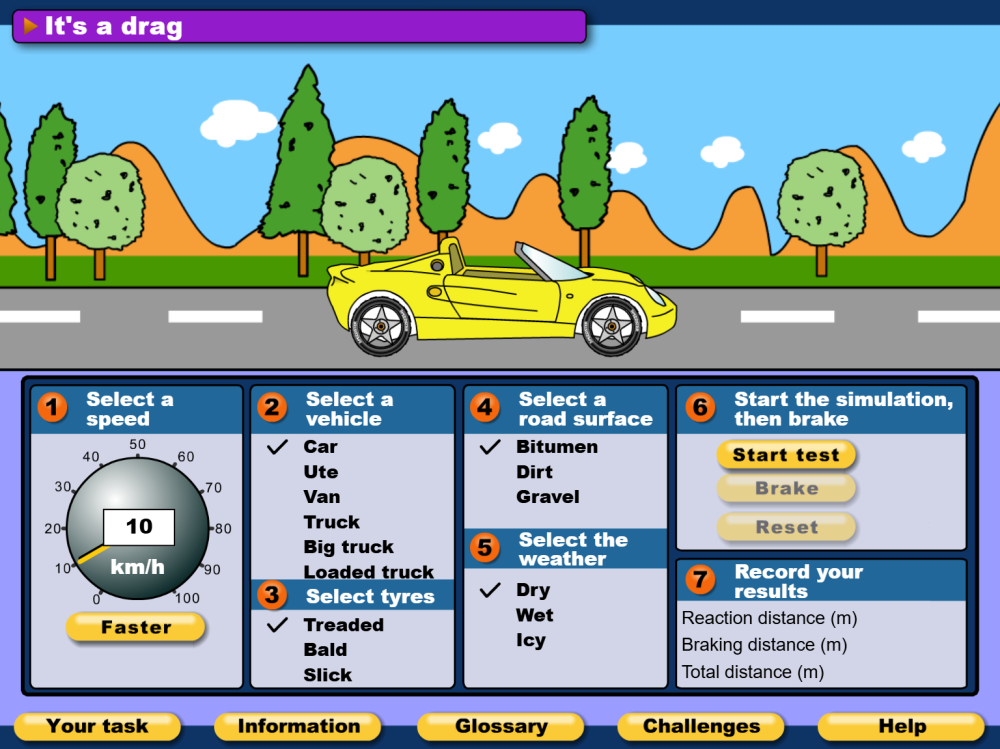
Explain to students that they will be using an online simulator to model how long it takes for a car to stop.
Students will need access to the It’s a drag website interactive. Provide students with a copy of the Braking distance Resource sheet.
(Slide 37) Discuss how scientists use models to represent, explain, and predict real-world phenomena that may be too complex, dangerous, or impractical to observe directly. All models have their limitations but they can help simplify things so that scientists can gain a greater understanding. In this instance, the digital model is simplified and uses mathematical equations as part of the programming.
(Slide 38) Explain that students will be measuring the distance a car will travel before it is able to stop. This distance is divided into two parts: the distance travelled during the reaction time and the distance travelled during the braking time.
Demonstrate the It’s a drag simulation and identify the reaction time and the braking distance.
Relate these to the graphs from the previous lesson.
In this part of the experiment, students will determine how the initial speed of the car affects the total stopping distance. Students will be increasing the speed of the car in 20 km/h increments. Discuss the need for experiments to be repeated several times to ensure the reliability of the test.
(Slide 39) ✎ STUDENT NOTES: Complete the tests and draw a graph of the relationship between starting speed and braking distance.
Discuss students’ findings.
- What type of model are you using?
- What are the limitations of this model? What doesn’t it do or show?
- Why is it important to practice using the braking simulation before starting your tests?
- What could happen if you didn’t understand how the program works before collecting data?
- What is the difference between reaction distance and stopping distance?
- Why can’t we just look at the braking distance when thinking about a car’s total stopping distance?
(Slide 40-41) In the second part of this experiment, students select different tyres, road surface, or weather as the independent variable. This can be done by allocating independent variables to each group of students and providing time for students to report back to the class. The effect of mass on a vehicle’s stopping distance will be covered in the next lesson, so the vehicle type should not be used as an independent variable at this stage.
- Why do you change only one variable in your tests?
- What is your independent/dependent variable?
- Will the braking time of an autonomous car be different to the braking time of a human driver?
- While the reaction time will be different between autonomous cars and humans, the braking time should not change.
- How do you think tyres/road surface/weather will affect the braking distance?
- Why do you think tyres/road surface/weather will increase the braking distance?
- How do the brakes work to stop the car?
- How will the tyres/road surface/weather affect the friction between the road and the tyres?
- How does this affect the stopping distance of the car?
✎ STUDENT NOTES: Complete the tests that examine the relationship between tyres or road surface or weather and stopping distance.
Scientific models
There are many different reasons that models are used in science.
There are many different reasons that models are used in science. Models may be physical (globe or skeleton), mathematical (equations that represent relationships), computerised (global warming) or conceptional (diagram of the water cycle).
Models can be used to:
- understand complex systems by breaking large systems into manageable parts. For example, climate models can be used to simulate Earth’s atmosphere and oceans to understand weather patterns and climate change.
- make predictions about how different conditions would affect the outcome. For example, models of disease spread help to predict how a new illness could move through a population.
- safely test hypotheses that might be too dangerous, expensive or unethical to test in real life. For example, car test simulations.
- communicate ideas through visualising and explaining difficult concepts. For example, the Bohr model of the atom used by students.
- explore things that can’t be directly observed due to being too large or too small. For example, to model the solar system or the structure of DNA.
All models have limitations, and it is useful to discuss these with students whenever the models are used.
The physics of braking
In real-world situations, braking is rarely linear.
When a car in linear motion brakes, the tyres use static friction to grip the road. Static friction occurs when two surfaces are in contact but not sliding over each other. When tyres are rolling forward, the ‘contact patch’ (the part of the tyre touching the road) is using static friction to move or to slow down.
If a car is swerving to avoid something, the driver will need to brake and turn at the same time. This reduces the size of the contact patch. When swerving happens too quickly, the tyres lose their grip and start to slide. The strong static friction between the rolling tyre and the road is replaced by a weaker kinetic friction between the sliding tyre and the road’s surface. The skid makes it harder to stop or steer. So, turning while braking doesn’t help reduce the speed of a crash. Instead, it either makes skidding more likely or prevents the driver from braking as hard as they could in a straight line, which could lead to a faster, more serious collision.
The Inquire phase allows students to cycle progressively and with increasing complexity through the key science ideas related to the core concepts. Each Inquire cycle is divided into three teaching and learning routines that allow students to systematically build their knowledge and skills in science and incorporate this into their current understanding of the world.
When designing a teaching sequence, it is important to consider the knowledge and skills that students will need in the final Act phase. Consider what the students already know and identify the steps that need to be taken to reach the level required. How could you facilitate students’ understanding at each step? What investigations could be designed to build the skills at each step?
Read more about using the LIA FrameworkFollowing an investigation, the Integrate routine provides time and space for data to be evaluated and insights to be synthesized. It reveals new insights, consolidates and refines representations, generalises context and broadens students’ perspectives. It allows student thinking to become visible and opens formative feedback opportunities. It may also lead to further questions being asked, allowing the Inquire phase to start again.
When designing a teaching sequence, consider the diagnostic assessment that was undertaken during the Launch phase. Consider if alternative conceptions could be used as a jumping off point to discussions. How could students represent their learning in a way that would support formative feedback opportunities? Could small summative assessment occur at different stages in the teaching sequence?
Read more about using the LIA FrameworkIntroducing acceleration
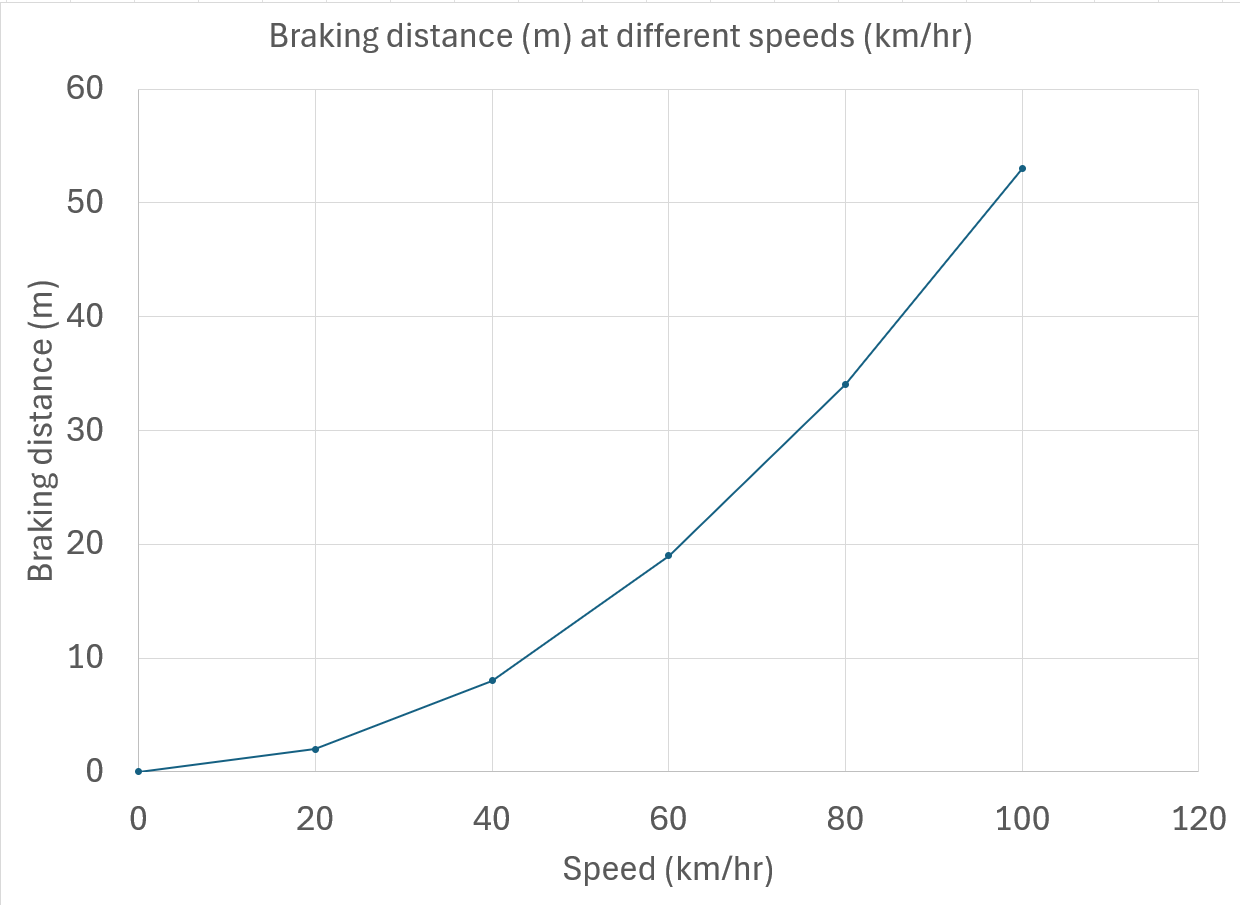
(Slides 42-43) Discuss the results of the experiment. The results should show that a faster starting speed of the car will result in a longer stopping distance.
✎ STUDENT NOTES: Draw a graph of the results.
Compare the student graph to slide 42.
Discuss students’ findings and reflect on the implications for school zones and autonomous cars.
- What trend did you notice between the car’s starting speed and the total stopping distance?
- Did stopping distance increase steadily, or was the increase more dramatic at higher speeds?
- What pattern did you observe between the car’s speed and braking distance when the car speed was doubled from 20 km/h to 40 km/h?
- The braking distance should increase by approximately a factor of 4 (22).
- This can be calculated using the equation $ \text{Velocity}^2 = \text{initial velocity}^2 + 2 \times \text{acceleration}\times\text{displacement}$ and solving for displacement.
- Students are not expected to understand the mathematical reasoning for this at this stage—noticing that the braking distance is closely related to the car’s speed is sufficient.
- The braking distance should increase by approximately a factor of 4 (22).
- How much did the braking distance increase when the speed increased by a factor of 3 (20 km/hr to 60 km/hr)?
- The braking distance should increase by a factor of 9 (32).
- How much did the braking distance increase when the speed increased by a factor of 4 (20 km/hr to 80 km/hr)?
- The braking distance should increase by a factor of 16 (42).
- Why do you think speed limits are lower near schools?
- How could your experiment results help explain the danger of speeding in school zones?
- If a child suddenly ran into the street near a school, how would a driver’s speed affect their ability to stop in time?
- Should speed limits in school zones be enforced more strictly based on this data? Why or why not?
- How could the data from this experiment be used to help self-driving cars make safer decisions?
- What kinds of sensors or programming might an autonomous car need to calculate stopping distance in real time?
(Slide 44) Students provide a summary of the results of their investigation into the effects of bald tyres/road surface/weather on the braking distance.
- What factors did you need to control in your test?
- How did the factor you investigated affect the braking distance of the car?
- Why do you think the bald tyres/road surface/weather had this effect?
- What do you think would happen if these factors were combined (bald tyres in wet weather)?
- Do you think the effects would be additive?
✎ STUDENT NOTES: Complete the discussion questions on the Braking distance Resource sheet.
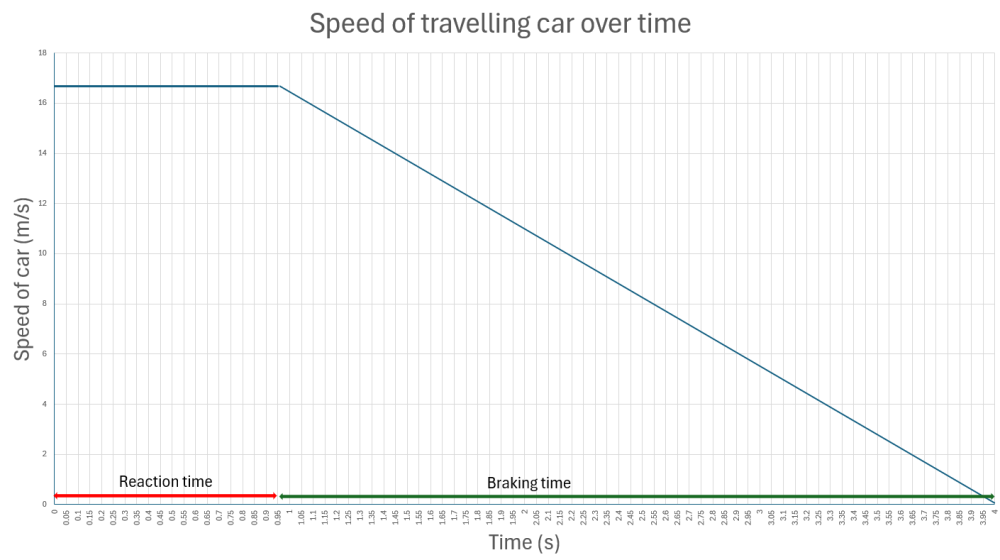
(Slide 45) On the graph, draw students’ attention to how quickly the speed of the car changes (a starting speed of 60 km/h and a final speed of 0 km/h). Identify the downward slope or gradient of the graph as an indication of the car slowing down.
- On the graph, how much does the speed change each second?
- Is it the same change each second?
- Does this mean it is speeding up or slowing down?
- What would a graph of a car with better brakes (stops faster) look like?
Pose the question: What would the graph/slope look like if the car were speeding up?
Discuss how the slope of the graph describes the acceleration of a car. Sloping up is positive acceleration (speeding up), and sloping down is negative acceleration (slowing down).
(Slide 46) Define acceleration as “the rate at which speed and direction changes”. Explain that acceleration can be positive (as an object increases its speed from 0 km/h to 60 km/h) or negative (as an object decreases its speed from 60 km/h to 0 km/h).
NOTE: The Australian Curriculum does not include the vectors of displacement or velocity. If your state curriculum includes vectors at this level, it is worth including extra Inquire phases to introduce this content.
✎ STUDENT NOTES: Write the definition of acceleration as “the rate that speed and direction changes”. Draw a graph showing positive acceleration and negative acceleration.
Show Eddie Woo discusses stopping distances and speed (2:05).
✎ STUDENT NOTES: Include examples of positive and negative acceleration from the video.
(Slide 47) Discuss how autonomous cars might need to modify the way they accelerate and drive on different road surfaces, weather, or as tyres wear out.
✎ STUDENT NOTES: Use argumentation (claim, reasoning, and evidence) to write at least one recommendation to an autonomous car manufacturer related to the way a car should drive on different road surfaces, weather, or as tyres wear out.
Reflect on the lesson
You might invite students to:
- explain how stopping distance calculations can be used to determine the speed limits on roads—for example, high-use roads that have pedestrians will usually have lower speed limits than roads with fewer pedestrians.
- re-examine the intended learning goals for the lesson and consider how they were achieved.
Acceleration
Acceleration is the rate at which an object’s velocity changes over time.

Acceleration is the rate at which an object’s velocity changes over time. In physics, acceleration is a vector quantity—it includes both magnitude (size) and direction. An object can be accelerating not just when it speeds up or slows down, but also when it changes direction.
To understand acceleration, it’s helpful to also understand displacement and velocity:
- Displacement is the overall change in position of an object, measured in a straight line from where the object started to where it ended. Displacement also includes direction (e.g. 50 metres east). It’s different from distance, which only measures how much ground was covered.
- Velocity is the rate of change of displacement. It tells us how fast and in what direction an object is moving (e.g. 10 m/s north).
Because velocity includes both speed and direction, acceleration can happen when an object speeds up (positive acceleration), slows down (negative acceleration), or changes direction (like turning a corner).
It is calculated using the formula:
$$ \text{Acceleration (m/s}^2\text{)} = \frac{\text{change in velocity (m/s)}}{\text{change in time (s)}}$$
For example, if a car speeds up from 10 m/s to 20 m/s in 5 seconds, the acceleration is
$$\begin{aligned} \text{Acceleration} &= \frac{20-10 \text{ (m/s)}}{5 \text{ (s)}}
\\ &= \frac{10}{5}\text{ (m/s}^2\text{)}
\\&= 2 \text{ m/s}^2\end{aligned}$$
Students may have several alternative conceptions about acceleration and velocity. One is the belief that acceleration and velocity are the same thing, when in fact they are different. Velocity describes how fast and in what direction an object is moving, while acceleration is the rate at which velocity changes. Some also think that acceleration and velocity must always be in the same direction, but this is not true. For example, when an object slows down, its (negative) acceleration is in the opposite direction to its (positive) velocity. Another misunderstanding is that velocity is a force, when it is actually a measure of motion, not an interaction between objects. It’s also incorrect to assume that if velocity is zero, acceleration must be zero. An object can have zero velocity at a moment (like at the top of a thrown ball's path) while still accelerating. Similarly, while velocity and speed are related, they are not the same—velocity includes direction, so two objects can have the same speed but different velocities. People often think that acceleration only means speeding up, but it can also mean slowing down or changing direction.