Newton meets AI
View Sequence overviewStudents will:
- identify people who may need autonomous cars.
- develop questions about how driving decisions are made in autonomous cars.
- determine the impact of distractions on reaction time.
Students will represent their understanding as they:
- use speed-time graphs to calculate the stopping distances of distracted drivers.
- plan and conduct an experiment that examines the impact of distractions on reaction time.
- draw speed-time graphs to represent the impact of different reaction times.
In this lesson, assessment is formative.
Feedback might focus on:
- students’ ability to quantitatively analyse the relationship between speed, distance, and time.
- students’ ability to plan and conduct an experiment.
- students’ ability to process and analyse data.
- students’ ability to evaluate the validity of a claim or argument.
Potential summative task
Students working at the achievement standard should:
- investigate a moving object to analyse and propose relationships between distance, time, and speed.
- plan and conduct safe, valid, and reproducible investigations to test relationships.
- select equipment and use it efficiently to generate and record appropriate sample sizes and replicable data with precision.
- select and construct effective representations to organise, process, and summarise data and information.
- analyse data to identify and explain patterns.
- evaluate the validity and reproducibility of methods and the validity of claims.
- construct logical arguments based on analysis of evidence to support conclusions and evaluate claims.
Refer to the Australian Curriculum content links on the Our design decisions tab for further information.
Whole class
Newton meets AI Resource PowerPoint
Videos:
- How do self-driving cars work? (3:16)
- The hidden autopilot data that reveals why Teslas crash (11:05)
- Meet Graham, TAC’s interactive sculpture by artist Patricia Piccinini (2:35)
Each group
Sticky notes
1 m ruler
Stopwatch
Timer or smartphone with timer app
Distraction object (e.g. loud sound, flashing lights, or a talking partner)
HIGH TECH ALTERNATIVE: Any reaction timer website which measures how long the user takes to press a button
Each student
Individual science notebook
Reaction time Resource sheet
Lesson
Re-orient
Discuss the challenges being faced by drivers when travelling on the roads. Ask students to identify the risks of drivers driving past the school, such as students chasing a ball onto the road or drivers opening car doors suddenly.
The Inquire phase allows students to cycle progressively and with increasing complexity through the key science ideas related to the core concepts. Each Inquire cycle is divided into three teaching and learning routines that allow students to systematically build their knowledge and skills in science and incorporate this into their current understanding of the world.
When designing a teaching sequence, it is important to consider the knowledge and skills that students will need in the final Act phase. Consider what the students already know and identify the steps that need to be taken to reach the level required. How could you facilitate students’ understanding at each step? What investigations could be designed to build the skills at each step?
Read more about using the LIA FrameworkIdentifying and constructing questions is the creative driver of the inquiry process. It allows students to explore what they know and how they know it. During the Inquire phase of the LIA Framework, the Question routine allows for past activities to be reviewed and to set the scene for the investigation that students will undertake. The use of effective questioning techniques can influence students’ view and interpretation of upcoming content, open them to exploration and link to their current interests and science capital.
When designing a teaching sequence, it is important to spend some time considering the mindset of students at the start of each Inquire phase. What do you want students to be thinking about, what do they already know and what is the best way for them to approach the task? What might tap into their curiosity?
Read more about using the LIA FrameworkAutonomous car safety
Pose the question: How would autonomous cars identify these hazards?
Discuss how autonomous cars are a recent technological development and many people do not know much about them. Explore how self-driving cars would support people who may have difficulty driving themselves, and how the needs of some people in society can drive the development of science and technology. Suggest that it might be useful to share what we do know.
Pose the question: What do we need to know about autonomous cars to decide if they are safe?
(Slide 21) Encourage students to collate information on autonomous cars on a series of sticky notes. Provide students time to write down all they know about autonomous cars on sticky notes (one idea/note). Collect the notes in one area and, if appropriate, sort the notes into general topics (e.g. mechanical-related, safety-related, software-related).
(Slide 22) Encourage students to brainstorm any questions they have about autonomous cars. Outline the rules for brainstorming:
- Ask as many questions as you can.
- Do not stop to discuss, judge, or answer questions.
- Write down every question exactly as it is stated.
- Change any statement into a question.
Collect the questions and collate them into groups of common questions related to the topic (e.g. sensor-related, accidents, programming decisions, driver/passenger-related).
(Slide 23) Show the video How do self-driving cars work? Artificial intelligence for STEM kids (3:16).
Draw on student questions related to safety and the previous discussion about the hazards of driving past the school. Flag the need for drivers to react quickly, particularly near a school.
Pose the question: How fast could you react (hit the brakes) to a child running onto a road?
Autonomous car sensors
Autonomous vehicles rely on a variety of sensors to perceive and interpret their surroundings.
Autonomous vehicles rely on a variety of sensors to perceive and interpret their surroundings, enabling safe and effective navigation. Different cars use different combinations of sensors. For example, Tesla relies on cameras to detect hazards, while other autonomous cars fuse the information from on two or more sensor systems.
LiDAR (Light Detection and Ranging) emits laser pulses to build high-resolution, three-dimensional maps of the environment. LiDAR is useful for measuring depth and identifying the shape and position of nearby objects, which allows the car to avoid obstacles. However, it is relatively expensive and can be affected by adverse weather conditions such as heavy rain or fog.
Radar (Radio Detection and Ranging) uses radio waves to detect objects and measure their speed and distance. It has a longer range that LiDAR and performs well in all weather conditions. Its main limitation is lower resolution, which makes it less effective at identifying object types or shapes.
Cameras, both visible-light and infrared, capture high-resolution images of the environment. They are used to recognise traffic lights, read signs, detect lane markings, and classify objects (e.g. distinguishing a pedestrian from a cyclist). Cameras are relatively inexpensive but are limited in low-light or poor weather conditions and need complex image processing techniques to extract useful information.
Ultrasonic sensors can be employed for close-range detection, especially during parking or low-speed manoeuvres. These sensors use sound waves to detect nearby objects and are highly effective at short distances. While inexpensive and reliable, their range is limited, and they are not suitable for high-speed driving or detailed object recognition.
An Inertial Measurement Unit (IMU) is also used to track the vehicle’s motion, measuring acceleration, rotation, and orientation. This data helps the vehicle estimate its position and movement, especially when GPS signals are weak or temporarily unavailable. However, IMUs are prone to drift over time and must be corrected using data from other sources.
GPS (Global Positioning System) provides location data for navigation and route planning. While it helps determine the vehicle’s position on a map, standard GPS often lacks the precision required for lane-level accuracy and can be disrupted in environments like tunnels or dense urban areas.
References
Ignatious, H. A., El-Sayed, H, & Khan, M. (2022). An overview of sensors in Autonomous Vehicles. Procedia Computer Science, 198, 736-741.
The Inquire phase allows students to cycle progressively and with increasing complexity through the key science ideas related to the core concepts. Each Inquire cycle is divided into three teaching and learning routines that allow students to systematically build their knowledge and skills in science and incorporate this into their current understanding of the world.
When designing a teaching sequence, it is important to consider the knowledge and skills that students will need in the final Act phase. Consider what the students already know and identify the steps that need to be taken to reach the level required. How could you facilitate students’ understanding at each step? What investigations could be designed to build the skills at each step?
Read more about using the LIA FrameworkThe Investigate routine provides students with an opportunity to explore the key ideas of science, to plan and conduct an investigation, and to gather and record data. The investigations are designed to systematically develop content knowledge and skills through increasingly complex processes of structured inquiry, guided inquiry and open inquiry approaches. Students are encouraged to process data to identify trends and patterns and link them to the real-world context of the teaching sequence.
When designing a teaching sequence, consider the diagnostic assessment (Launch phase) that identified the alternative conceptions that students held. Are there activities that challenge these ideas and provide openings for discussion? What content knowledge and skills do students need to be able to complete the final (Act phase) task? How could you systematically build these through the investigation routines? Are there opportunities to build students’ understanding and skills in the science inquiry processes through the successive investigations?
Read more about using the LIA FrameworkDistracting reactions
Explain to students that they can measure how long it takes for a person to react when stopping a car.
Wonder aloud what it would be like to drive with many people in the car. Do drivers become distracted?
Provide students with a copy of the Reaction time Resource sheet.
(Slide 24) Explain that students will be measuring how quickly they would react if they were driving a car. First, they will test without distractions.
✎ STUDENT NOTES: Complete the first section of the Reaction time Resource sheet, including writing a hypothesis on the first page.
Outline the reaction time test:
- Student 1 holds the ruler vertically above Student 2’s thumb and forefinger. The ‘0’ of the ruler should be equal with the thumb and forefinger.
- Student 1 drops the ruler randomly (without warning) and Student 2 tries to catch it as quickly as possible between their thumb and forefinger.
- Record the position of Student 2’s fingers on the ruler in cm.
Discuss how the experiments must be repeated several times to ensure the reliability of the test.
Allow students time to complete this test without distractions.
- Was the method used valid? Does the test allow reaction times to be tested effectively?
- Was the sample size large enough?
- Were all the variables identified and controlled?
- Is the test reproducible?
- Are the results clearly and accurately shown?
- Is the analysis of results reliable (and not overstated)?
- Are the limitations of the test, results and analysis described?
(Slide 25) Discuss how the experiment could be repeated with a variety of distractions, including having a conversation, a noisy classroom, flashing lights, etc.
✎ STUDENT NOTES: Students plan how to modify the test to determine if distractions affect a driver’s reaction time.
- What type of distractions could affect a person’s reaction time?
- How could you control the environment to test reaction times with and without distractions?
- Who will have their reaction times tested? Why did you choose that person?
- How could you make sure your test is reliable?
- Why do you think you may need to repeat the test many times?
- How will you collect or record your data?
- What variable might be difficult to control?
- How will you make sure your experiment is safe and respectful to everyone?
✎ STUDENT NOTES: Students conduct their experiment and gather and record data.
The Inquire phase allows students to cycle progressively and with increasing complexity through the key science ideas related to the core concepts. Each Inquire cycle is divided into three teaching and learning routines that allow students to systematically build their knowledge and skills in science and incorporate this into their current understanding of the world.
When designing a teaching sequence, it is important to consider the knowledge and skills that students will need in the final Act phase. Consider what the students already know and identify the steps that need to be taken to reach the level required. How could you facilitate students’ understanding at each step? What investigations could be designed to build the skills at each step?
Read more about using the LIA FrameworkFollowing an investigation, the Integrate routine provides time and space for data to be evaluated and insights to be synthesized. It reveals new insights, consolidates and refines representations, generalises context and broadens students’ perspectives. It allows student thinking to become visible and opens formative feedback opportunities. It may also lead to further questions being asked, allowing the Inquire phase to start again.
When designing a teaching sequence, consider the diagnostic assessment that was undertaken during the Launch phase. Consider if alternative conceptions could be used as a jumping off point to discussions. How could students represent their learning in a way that would support formative feedback opportunities? Could small summative assessment occur at different stages in the teaching sequence?
Read more about using the LIA FrameworkDistracting consequences
Discuss the results of students’ experiments, including the types of distractions used and the effect of distraction on reaction time. Identify the similarities in the way each group conducted their experiment and explore the purpose of the similarities. For example, some groups may have used noise as well as visual distractions. Most groups would have used a single person as their test subject (controlling a variable).
Identify the commonalities of the results: distraction increased the reaction time of an individual.
Draw a speed-time graph of a car travelling at a steady 60 km/h (16.67 m/s). This will be a horizontal line.
(Slide 26) If required, describe how 60 km/h is equivalent to 16.67 m/s: 1 kilometre = 1000 metres and 1 hour = 3 600 seconds, so 1 km/h can also be written as 1000/3 600 = 0.28 metres/second.
(Slide 27) Use the graph to tell a story of a car travelling at a constant speed of 16.67 m/s (60 km/h) when a child runs onto the road. Describe how the driver hits the brake at 0.35 seconds and then the car starts to slow down.
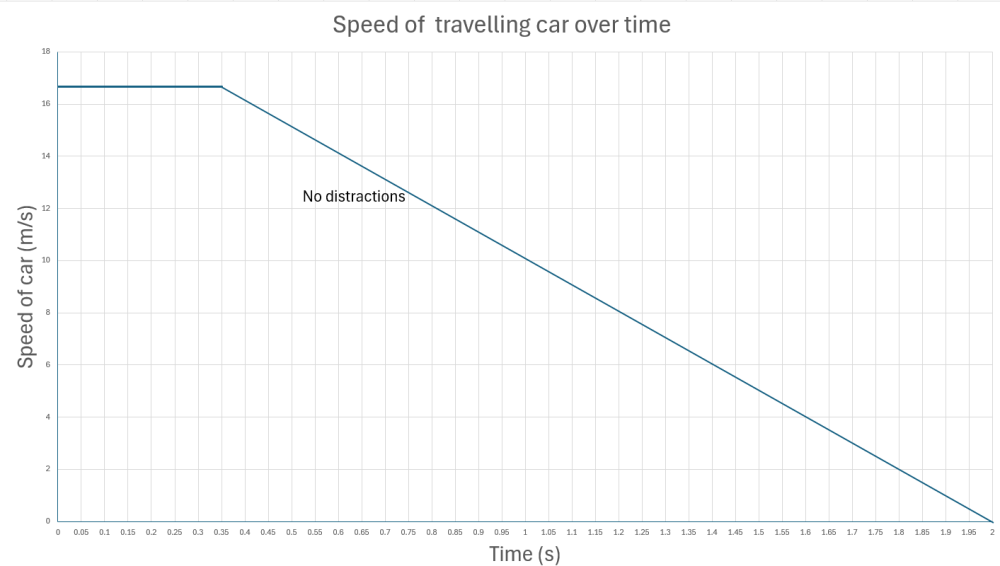
- When did the driver react?
- From the graph, 0.35 seconds.
- How does this compare to your reaction time measurements with and without distractions?
- How does the speed change once the driver starts braking?
- How does the graph show this?
- From this graph, how much time does it take for the car to stop?
✎ STUDENT NOTES: Draw the graph in notebooks with the speed and the reaction times and final stopping times.
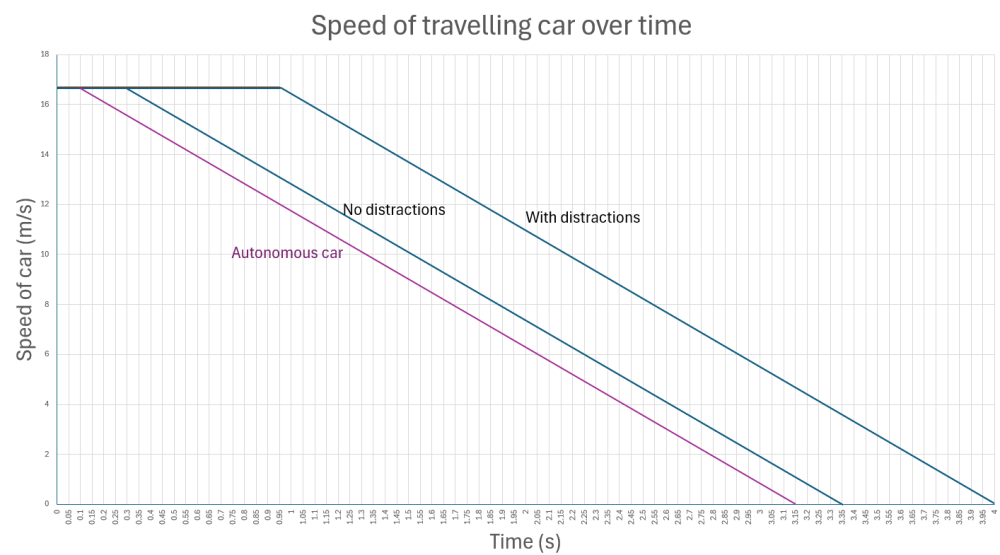
(Slide 28) Discuss how distractions mean that the human driver takes longer to react (distraction reaction time = 0.95 s versus no distraction time = 0.35 s).
- Are both cars driving at the same speed? How is this represented on the graph?
- When did the non-distracted driver start braking? How do you know this?
- How does the quicker reaction time change the total amount of time it takes for the car to stop?
- Would a shorter time to stop affect the distance the car travels?
- How would a shorter stopping time affect the distance the car travels?
Pose the question: Which car would take a longer distance to stop?
(Slide 28 animation) Explain that this can be worked out using the graph. Identify the length of time it took for the distracted driver to start applying the brakes (0.95 s) and the speed (16.67 m/s). Draw the rectangle under the graph and calculate the area (15.84 m). Remind students that this is the distance the car travels before braking starts.
(Slide 28 animation) Compare the distance travelled by the distracted driver to the distance the non-distracted driver travels before braking: $ \text{time (0.30s)} \times \text{speed (16.67m)} = 5.00\text{ m}$.
✎ STUDENT NOTES: Describe how the distance travelled by the car can be determined from the area under a speed/time graph. Write the calculations for the distance both cars travel in a notebook.
- How much further does the distracted driver travel compared to the non-distracted driver?
- How does this affect the overall stopping distance of the cars? Which car will travel further?
- Do both cars brake in the same way?
- Yes. The lines that show the cars braking on the graph are parallel. This shows that both cars brake in the same way.
- How long does it take for both cars to stop after the brake was applied?
- 3.05 seconds.
- How could we work out how far the cars travel during the braking?
- By calculating the area under the graph.
- Would both cars have the same braking distance?
- Yes. The slopes of the cars slowing are the same angle and size. This means the area under the graph (distance travelled) is the same.
(Slide 28 animation) Support students to calculate the area under the graph (a triangle) for both cars to compare and confirm that both cars travelled the same distance while braking.
$ \begin{aligned} \text{Braking distance} &= \frac{1}{2}base\times height \text{ (graph)}
\\&= \frac{1}{2}time\text{ (s) }\times speed \text{ (m/s)}
\\&=\frac{1}{2}\times3.05\times16.67
\\&=25.42\text{m}\end{aligned}$
Discuss how the distance travelled by the two cars (reaction distance + stopping distance) is different:
- Non-distracted driver = 30.42 m
- Distracted driver = 41.29 m.
✎ STUDENT NOTES: Record the calculations in your notebook.
(Slide 29) Explain that there are other ways to calculate the distance travelled. Compare the calculations of reaction times (not braking times) from the graphs to the speed equation from the previous lesson. Support the students to rearrange the ‘Speed’ equation and model the calculation of the distance travelled during the reaction time.
From:
$$ \text{Speed} = \frac{\text{distance travelled}}{\text{time taken}}$$
To:
$$ \text{Distance} = \text{speed}\times\text{time}$$
✎ STUDENT NOTES: Use the above formula to calculate the distance the car would travel before its driver would start braking (with and without distractions).
Compare the two approaches (graph and equation) to determine the same answer. Discuss how the equation could not be used to determine the distance travelled by the slowing down car.
(Slide 30) Pose the question: Would an autonomous car react faster than human drivers?
Discuss how autonomous cars have a reaction time of 0.1 s once the risk has been identified.
(Slide 31) Compare the reaction distance and stopping distance of a (non-distracted) human driver and an autonomous car.
- How much quicker is the autonomous car in applying the brake?
- How would this affect the distance travelled by the car before it stops?
- How could we calculate this?
(Slide 32-33) Allow students time to calculate the area under the autonomous car graph: $ \text{reaction time} + \text{stopping time} = 1.67\text{ m} + 25.42\text{ m} = 27.09\text{ m}$.
Compare all three stopping distances:
- Autonomous car = 27.09 m
- Non-distracted driver = 30.42 m
- Distracted driver = 41.29 m
(Slide 34) Encourage students to use argumentation to make a claim supported by evidence and reasoning to answer the question: Would autonomous cars make it safer to walk to school?.
✎ STUDENT NOTES: Students make claims supported by evidence and reasoning. For example:
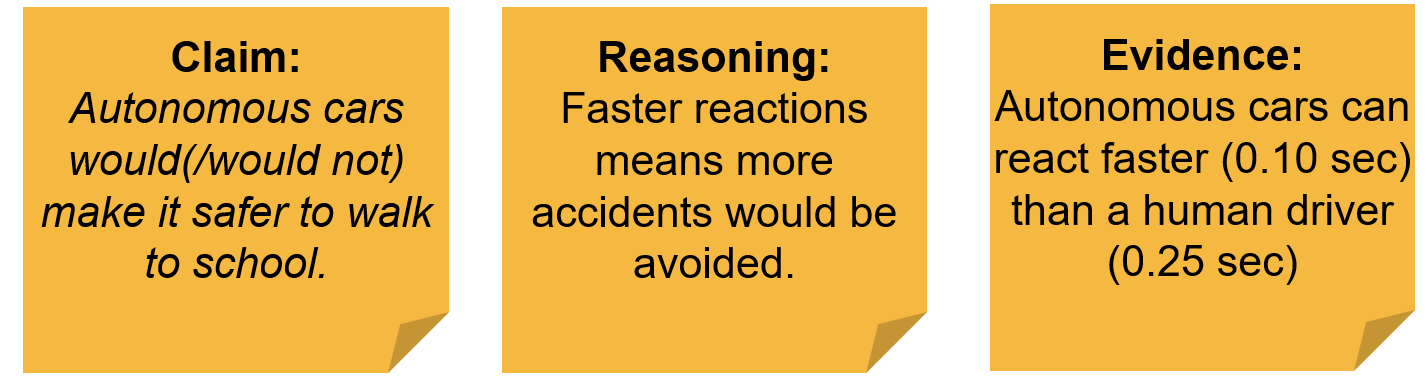
Pose the question: Do autonomous cars become distracted?
Show the first 3:18 minutes of The hidden autopilot data that reveals why Teslas crash (11:05). This video includes footage of car accidents (the crashes become more disturbing beyond 3:18 minutes). Before playing the video, consider whether any students might have been impacted by vehicle accidents. Provide these students with a warning about the content and an opportunity to leave the room if required.
Remind students of the earlier video about how most autonomous vehicles use a variety of sensors to detect the environment around the car, and that the sensitivity of the sensors will improve over time.
Discuss if any students want to modify their claims in light of the new evidence. Explain how this is how scientists constantly revisit hypothesis and concepts when new data becomes available.
✎ STUDENT NOTES: Rewrite argumentation claims in light of new data.
Discuss how students will examine the way cars brake and how the programmers of autonomous cars could use this to minimise accidents in future lessons.
Reflect on the lesson
You might invite students to:
- investigate the safety features used in modern cars.
- explore Project Graham, an art project developed to design “the only person who could survive a car accident”.
Autonomous cars
SAE International identifies six levels of autonomous cars.
SAE International (previously called the Society of Automotive Engineers) identifies six levels of autonomous cars, from Level 0 (no automation) to Level 5 (full automation). These levels are used globally to classify the capabilities of autonomous vehicles.
- Level 0: (no automation) The driver is fully responsible for all driving tasks but may be assisted by warnings (lane departure alerts).
- Level 1: (driver assistance) The vehicle can assist with either steering or acceleration/deceleration, but not both. For example, adaptive cruise control OR lane centring.
- Level 2: (partial automation) The vehicle can control both steering and speed, but the driver must monitor and be ready to take control at all times. For example: adaptive cruise control AND lane centring.
- Level 3: (conditional automation) The vehicle can perform all driving tasks in limited conditions (like highway driving). The driver must be ready to intervene when the system requests or when all conditions are not met.
- Level 4: (high automation) The vehicle can drive itself without human input in specific environments or conditions (like geofenced areas).
- Level 5: (full automation) The vehicle can drive itself anywhere, anytime, under all conditions. No steering wheel or pedals are needed.
Findings from Level 1-4 autonomous vehicle trials in California highlighted a critical challenge: while these vehicles are designed to improve safety, they are not yet consistently reliable. When automated systems fail or reach their limits, they disengage and rely on the human driver to take over. This transition must happen quickly and safely, requiring immediate human response.
Key findings from the research include:
- Average reaction time: Drivers took an average of 0.83 seconds to take back control after the autonomous system disengaged. This remained fairly stable across different companies.
- Factors affecting reaction time: Reaction times varied depending on the type of disengagement, road conditions, and how many miles the vehicle had driven autonomously.
- Impact of trust: Drivers who experienced more disengagements were more likely to take manual control, showing reduced trust in the system. However, as they gained more experience (measured by kilometres driven), trust increased and reaction times became slower, suggesting a growing confidence in the technology.
References
Dixit, V. V., Chand, S., & Nair, D. J. (2016). Autonomous Vehicles: Disengagements, Accidents and Reaction Times. PLOS ONE, 11(12), e0168054. https://doi.org/10.1371/journal.pone.0168054