Newton meets AI
View Sequence overviewStudents will:
- use the TRAAP method to identify the validity of secondary data.
- develop an investigable question that can be asked regarding road traffic fatalities.
- develop a hypothesis for the question.
- understand the importance of cleaning available data.
- use secondary data to answer the question being asked.
Students will represent their understanding as they:
- develop an investigable question using road traffic fatalities.
- clean/remove unwanted data from the Australian Road Deaths Database: Fatalities.
- use the available data to draw a conclusion related to their question.
- communicate the question and conclusion to an appropriate audience.
In this lesson, assessment is formative.
Feedback might focus on:
- constructing an argument, supported by data, to answer a question regarding the causes or distribution of road fatalities. This may include supporting arguments for lower speed limits in school zones.
Whole class
Newton meets AI Resource PowerPoint
Each group
Access to the Australian Road Deaths Database
Each student
Individual student notebook
Access to a digital spreadsheet program (e.g. Microsoft Excel)
Lesson
Re-orient
Review how quickly autonomous cars react and the factors that need to be considered when planning for autonomous driving.
These may include:
- the speed the car is travelling.
- the conditions of the tyres, road, and weather.
- the number of people in the car (mass).
- the use of seatbelts.
Discuss how these factors also affect human drivers.
The Inquire phase allows students to cycle progressively and with increasing complexity through the key science ideas related to the core concepts. Each Inquire cycle is divided into three teaching and learning routines that allow students to systematically build their knowledge and skills in science and incorporate this into their current understanding of the world.
When designing a teaching sequence, it is important to consider the knowledge and skills that students will need in the final Act phase. Consider what the students already know and identify the steps that need to be taken to reach the level required. How could you facilitate students’ understanding at each step? What investigations could be designed to build the skills at each step?
Read more about using the LIA FrameworkIdentifying and constructing questions is the creative driver of the inquiry process. It allows students to explore what they know and how they know it. During the Inquire phase of the LIA Framework, the Question routine allows for past activities to be reviewed and to set the scene for the investigation that students will undertake. The use of effective questioning techniques can influence students’ view and interpretation of upcoming content, open them to exploration and link to their current interests and science capital.
When designing a teaching sequence, it is important to spend some time considering the mindset of students at the start of each Inquire phase. What do you want students to be thinking about, what do they already know and what is the best way for them to approach the task? What might tap into their curiosity?
Read more about using the LIA FrameworkTrusting data
(Slide 68) Revise the TRAAP method for identifying valid data.
- T: Timeliness: When was the information published or updated?
- R: Relevance: Is it relevant to the discussions on road safety?
- A: Authority: Is the publisher of the information an expert on the information?
- A: Accuracy: Can the information be verified by another source?
- P: Purpose: Why was the database published?
Examine the data provided by the website Australian Road Deaths Database. Identify that the data is sourced from reports to the state and territory road safety authorities by the police each month. Refer to the Australian Road Deaths Database Data Dictionary for the full details of the source information.
Students can download the spreadsheet on fatalities by selecting ‘Explore’ and ‘Go to resource’.
Identify the different levels of information that are provided in this database, including crash ID, state/territory, month, year, day of the week, time, crash type, speed limit, road user, gender, age, and others.
Discuss the complexity of all the information and how it can make it difficult to see any trends in the data.
(Slide 69) Demonstrate how to remove unwanted data by selecting column A (Crash ID) and deleting the column.
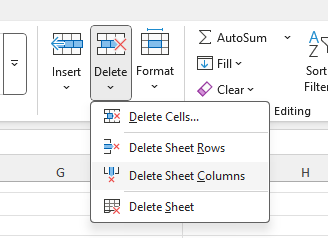
The top 4 rows can also be removed using this approach.
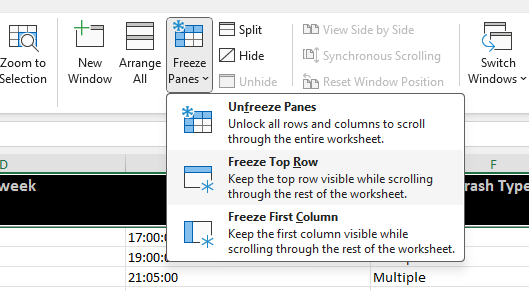
(Slide 70) Freeze the top row so that the titles of each column will not be lost (Select ‘View’ tab and ‘Freeze Top Row’).
(Slide 71) Demonstrate how data can be sorted to identify key data by selecting the entire table (selecting the arrow in the top left-hand corner of the rows and columns).
Select the ‘Data’ tab, and ‘Sort’.
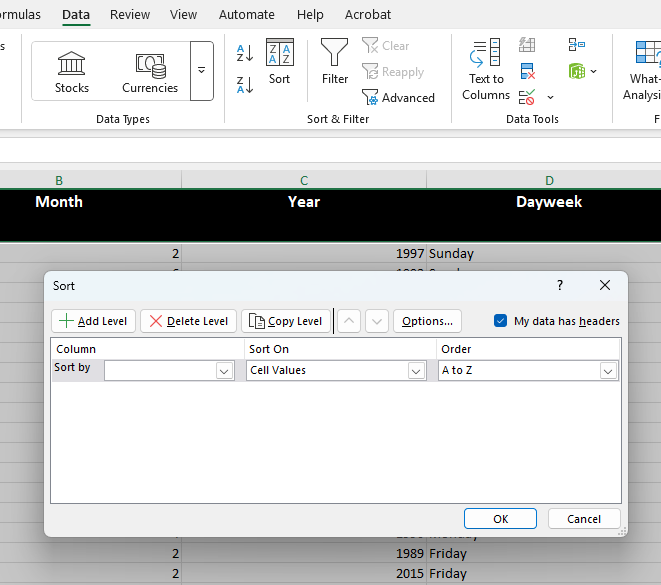
The data can now be sorted according to state. The year of the accidents can also be added to the ‘Sort’ function, by ‘Add Level’.
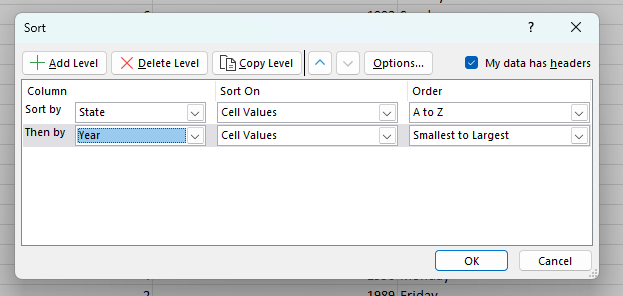
Students should be able to concentrate their data to their state and within a set time period.
(Slide 72) Pose the question: What factors could affect the number of road fatalities in our state?
The Inquire phase allows students to cycle progressively and with increasing complexity through the key science ideas related to the core concepts. Each Inquire cycle is divided into three teaching and learning routines that allow students to systematically build their knowledge and skills in science and incorporate this into their current understanding of the world.
When designing a teaching sequence, it is important to consider the knowledge and skills that students will need in the final Act phase. Consider what the students already know and identify the steps that need to be taken to reach the level required. How could you facilitate students’ understanding at each step? What investigations could be designed to build the skills at each step?
Read more about using the LIA FrameworkThe Investigate routine provides students with an opportunity to explore the key ideas of science, to plan and conduct an investigation, and to gather and record data. The investigations are designed to systematically develop content knowledge and skills through increasingly complex processes of structured inquiry, guided inquiry and open inquiry approaches. Students are encouraged to process data to identify trends and patterns and link them to the real-world context of the teaching sequence.
When designing a teaching sequence, consider the diagnostic assessment (Launch phase) that identified the alternative conceptions that students held. Are there activities that challenge these ideas and provide openings for discussion? What content knowledge and skills do students need to be able to complete the final (Act phase) task? How could you systematically build these through the investigation routines? Are there opportunities to build students’ understanding and skills in the science inquiry processes through the successive investigations?
Read more about using the LIA FrameworkCleaning and using data
Encourage students to ask open-ended questions about the data.
- What do you notice?
- What patterns can you find?
- How do these variables seem to be related?
- What is the relationship between...
- How does ___ affect ___?
- Is there a link between...?
✎ STUDENT NOTES: Brainstorm a list of questions that can be asked about the data.
(Slide 73) Support students in turning broad questions into specific, investigable questions by guiding them to identify two key variables (independent variable and dependent variable).
- I wonder if there are more fatalities at 60 km/h or 40 km/h.
- I wonder if there are more fatalities on weekends or weekdays.
- I wonder if there are more male or female fatalities.
- I wonder if more young or old pedestrians are killed in car accidents.
- What would be the independent variable in your question?
Let students share their questions with peers or in small groups to clarify their question. Encourage peer feedback and revise questions for clarity and focus.
- Is the data available?
- Can the question be answered by analysing the data?
- Is the question measurable and focused?
- Is the question specific and easy to understand?
- Does it avoid vague terms like "better" or "interesting"?
- Example: Why are car crashes bad? is too vague. How has the number of road fatalities in NSW changed from 2010 to 2020? is an answerable question.
- Does the question involve interpreting data, finding patterns, or making comparisons?
- Does the question require more than a yes/no answer or a single fact?
- Does it relate to a real-world issue or scientific concept?
✎ STUDENT NOTES: Write your finalised question. Identify the secondary data that will be needed to answer the question.
Encourage students to copy the data to a new tab on the spreadsheet. This allows the original data to be available should students accidentally remove data that is later needed. Use the new data set to remove all unwanted/irrelevant data.
NOTE: In the spreadsheet, ‘-9’ is used for missing/unknown values.
Allow students time to identify the data that is useful to answer their question.
✎ STUDENT NOTES: Collate the final data and represent the data using a graph or other forms.
The Inquire phase allows students to cycle progressively and with increasing complexity through the key science ideas related to the core concepts. Each Inquire cycle is divided into three teaching and learning routines that allow students to systematically build their knowledge and skills in science and incorporate this into their current understanding of the world.
When designing a teaching sequence, it is important to consider the knowledge and skills that students will need in the final Act phase. Consider what the students already know and identify the steps that need to be taken to reach the level required. How could you facilitate students’ understanding at each step? What investigations could be designed to build the skills at each step?
Read more about using the LIA FrameworkFollowing an investigation, the Integrate routine provides time and space for data to be evaluated and insights to be synthesized. It reveals new insights, consolidates and refines representations, generalises context and broadens students’ perspectives. It allows student thinking to become visible and opens formative feedback opportunities. It may also lead to further questions being asked, allowing the Inquire phase to start again.
When designing a teaching sequence, consider the diagnostic assessment that was undertaken during the Launch phase. Consider if alternative conceptions could be used as a jumping off point to discussions. How could students represent their learning in a way that would support formative feedback opportunities? Could small summative assessment occur at different stages in the teaching sequence?
Read more about using the LIA FrameworkCausation vs correlation
(Slide 74) Discuss how cleaning the data made it easier to identify trends or patterns in the key variables. Identify the risks involved, such as removing other data that might also have affected the dependent variable.
- What does it mean to ‘clean’ data? What kinds of data might be removed or changed?
- Why is it important to clean data before analysing it? What problems might happen if we don’t?
- How did cleaning the data help you see patterns or relationships between variables more clearly?
- What kind of errors or outliers were removed during the cleaning process? How did that affect your results?
- Can removing ‘bad data’ make your conclusions more accurate? Why or why not?
- What could happen if you accidentally remove data that was actually important?
- Should we always remove outliers or strange data points? Why or why not?
- How can we make sure our data cleaning choices are fair, honest, and based on good reasoning?
- If two people cleaned the same dataset differently, could they come to different conclusions? What does that tell you?
(Slide 75) Discuss students’ findings and the difference between causation (when one variable causes a change in another variable) and correlation (when two variables move at the same time, but one does not cause the other to move).
- What does it mean if two things are correlated? Can you give an example?
- What is causation? How is it different from correlation?
- Why is it important not to assume that correlation means causation?
- Ice cream sales and the frequency of sunburns both increase in December. Does this mean ice cream causes sunburn? Why or why not?
- How can scientists test whether a relationship is actually causal?
- Why are controlled experiments better for finding causation than just looking at data trends?
- Why do people often jump to conclusions when they see two things happen together?
- What are the risks of making decisions based on a false assumption of causation?
✎ STUDENT NOTES: Describe the conclusions that you have drawn as a result of the data. Describe the limitations of these conclusions.
Discuss if students had all the data that they needed to answer their question. If not, brainstorm where/how they could obtain the data.
Discuss how students could communicate their questions and conclusions to different audiences. Consider which audiences would be most interested in the conclusions and how they could be communicated most effectively.
✎ STUDENT NOTES: Draw an infographic that communicates the question and conclusion to an appropriate audience.
Reflect on the lesson
You might invite students to:
- identify other questions that could be answered by the data.
- examine other infographics to identify the factors that help in effective communication.
- re-examine the intended learning goals for the lesson and consider how they were achieved.
- discuss how they were thinking and working like scientists during the lesson.
Causation vs correlation
Knowing the difference between correlation and causation helps students accurately interpret data and avoid false conclusions.

Knowing the difference between correlation and causation helps students to understand data correctly, avoid incorrect conclusions, and make better decisions based on evidence.
Correlation is a way of describing the relationship between two variables. In a correlating relationship, when one variable changes, the other variable also changes (either in the same or opposite direction). For example, there is a positive correlation between casual hours worked and income—an increase in hours worked corresponds to an increase in income. A rise in prices corresponding to a fall in purchasing power is an example of a negative correlation.
However, correlation does not mean causation. Just because two variables move together doesn’t mean one causes the other. For example, ice cream sales and the frequency of sunburns both increase in December, but one doesn’t cause the other. Instead, the season is the actual influencing factor.
Causation means that one event or variable directly causes a change in another. For example, smoking causes an increased risk of lung cancer.
To establish causation, scientists use controlled experiments, where two similar groups are treated differently and the results are compared. This method is often used in medical studies. When controlled studies aren’t ethical or possible, researchers use observational studies to look for possible causal links over longer time periods.