Newton meets AI
View Sequence overviewStudents will:
- identify that speed is the distance travelled in a unit of time.
- draw graphs to represent the speed of a person walking.
- determine that a faster speed means that a person will travel further in a unit of time.
Students will represent their understanding as they:
- generate data on the distance travelled over a unit of time at different speeds.
- draw distance/time graphs for different speeds.
In this lesson, assessment is formative.
Feedback might focus on:
- students’ ability to quantitatively analyse the relationship between speed, distance, and time.
- students’ ability to plan and conduct an experiment.
- students’ ability to process and analyse data.
- students’ ability to evaluate the validity of a claim or argument.
Potential summative assessment
Students working at standard should:
- propose and articulate the relationship between distance, time and speed.
Whole class
Newton meets AI Resource PowerPoint
Each group
Long tape measure (at least 10 m)
Metre rulers
10 cones or objects to use as markers
Stopwatch
Metronome
Each student
Individual science notebook
Measuring speed Resource sheet
Lesson
Re-orient
Remind students of their observations of cars moving past the school from the previous lesson.
(Slide 14) Pose the question: What do we mean when we say a car is speeding?
Discuss the different times the cars from the previous lesson took to travel the distance between the two points on the road. Compare the different times that were recorded, identifying the cars that took the shortest and longest times.
The Inquire phase allows students to cycle progressively and with increasing complexity through the key science ideas related to the core concepts. Each Inquire cycle is divided into three teaching and learning routines that allow students to systematically build their knowledge and skills in science and incorporate this into their current understanding of the world.
When designing a teaching sequence, it is important to consider the knowledge and skills that students will need in the final Act phase. Consider what the students already know and identify the steps that need to be taken to reach the level required. How could you facilitate students’ understanding at each step? What investigations could be designed to build the skills at each step?
Read more about using the LIA FrameworkIdentifying and constructing questions is the creative driver of the inquiry process. It allows students to explore what they know and how they know it. During the Inquire phase of the LIA Framework, the Question routine allows for past activities to be reviewed and to set the scene for the investigation that students will undertake. The use of effective questioning techniques can influence students’ view and interpretation of upcoming content, open them to exploration and link to their current interests and science capital.
When designing a teaching sequence, it is important to spend some time considering the mindset of students at the start of each Inquire phase. What do you want students to be thinking about, what do they already know and what is the best way for them to approach the task? What might tap into their curiosity?
Read more about using the LIA FrameworkFast speed
Pose the question: Which car was the fastest—the car that took the most time or the car that took the least time?
Discuss how a quick/short time to travel a distance means that the car is fast (moving at a higher speed).
Pose the question: Did the speed of the cars passing the school stay the same, or did they change?
Discuss how it can be difficult to see any small changes in a car’s speed over such a short distance.
Challenge students: Can you walk at a constant speed?
The Inquire phase allows students to cycle progressively and with increasing complexity through the key science ideas related to the core concepts. Each Inquire cycle is divided into three teaching and learning routines that allow students to systematically build their knowledge and skills in science and incorporate this into their current understanding of the world.
When designing a teaching sequence, it is important to consider the knowledge and skills that students will need in the final Act phase. Consider what the students already know and identify the steps that need to be taken to reach the level required. How could you facilitate students’ understanding at each step? What investigations could be designed to build the skills at each step?
Read more about using the LIA FrameworkThe Investigate routine provides students with an opportunity to explore the key ideas of science, to plan and conduct an investigation, and to gather and record data. The investigations are designed to systematically develop content knowledge and skills through increasingly complex processes of structured inquiry, guided inquiry and open inquiry approaches. Students are encouraged to process data to identify trends and patterns and link them to the real-world context of the teaching sequence.
When designing a teaching sequence, consider the diagnostic assessment (Launch phase) that identified the alternative conceptions that students held. Are there activities that challenge these ideas and provide openings for discussion? What content knowledge and skills do students need to be able to complete the final (Act phase) task? How could you systematically build these through the investigation routines? Are there opportunities to build students’ understanding and skills in the science inquiry processes through the successive investigations?
Read more about using the LIA FrameworkConstant speed
(Slide 15) Explain to students that they will try to model constant (unchanging) speed by walking at a constant speed for 10 metres.
Provide students with a copy of the Measuring speed Resource sheet and allow students time to practice walking 10 metres in 10 seconds along the tape measure. Each group should select:
- a Walker (to walk the 10 m).
- a Timer (to use the metronome or time to count the seconds aloud).
- several Markers (to place cones at the location of the Walker each second).
Discuss how the Markers will identify the location of the Walker at each second. The Walker may need to carry a metre ruler hanging down their side to identify their centre of mass each second. The Markers should practice placing cones along the tape measure every second (as counted by the Timer).
When students are ready, the Timer should start the metronome and count down for the Walker to start (ready, set, go). On go:
- the Walker should walk at their own pace alongside the tape measure, not in time to the metronome.
- the Timer should count the seconds aloud.
- at each second, the Markers should place a cone on the tape measure at the Walker’s centre of mass.
✎ STUDENT NOTES: Record the location of each cone on the 10 m tape. Calculate the distance travelled during each time period (1 second). Draw a graph of the distance travelled during each time period (every second).
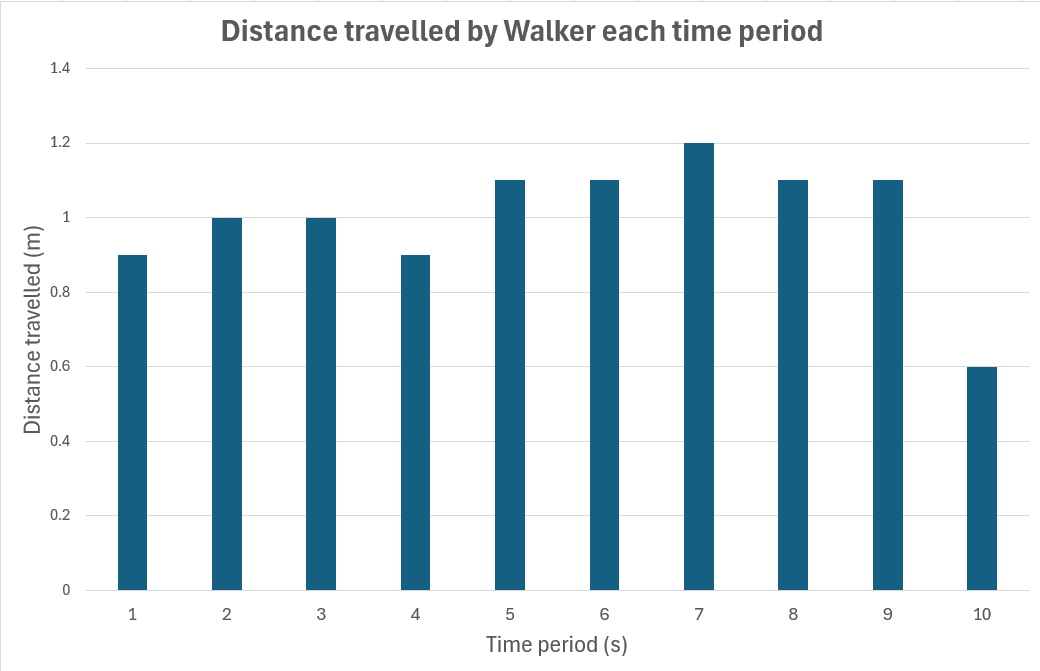
- What does each column represent on the graph?
- The distance travelled each second.
- During which time period did the Walker travel the fastest? How do you know?
- The tallest column means Walker travelled the greatest distance in the time period (fastest).
- Why might the Walker have travelled more slowly during some time periods?
- The Walker might have been talking to a friend or slowed down other times to keep step with the Timer. The Marker might not have been ready to place the cone in the correct position.
- How could we work out the average speed that Walker travelled?
- By dividing the total distance travelled by the total time taken.
Discuss if the Markers were able to accurately record the position of the Walker. Consider any errors and how that would affect the shape of the column graph.
Discuss how a constant speed on the graph could be shown with a horizontal line (line of best fit).
(Slide 16-17) Discuss how the graph might change if the Walker were moving faster (travelling at a greater speed).
Allow students to repeat the investigation and measurements with the Walker travelling faster.
✎ STUDENT NOTES: Record the location of each cone on the 10 m tape. Calculate the distance travelled during each time period (1 second). Draw a second graph of the distance travelled during each time period (every second).
The Inquire phase allows students to cycle progressively and with increasing complexity through the key science ideas related to the core concepts. Each Inquire cycle is divided into three teaching and learning routines that allow students to systematically build their knowledge and skills in science and incorporate this into their current understanding of the world.
When designing a teaching sequence, it is important to consider the knowledge and skills that students will need in the final Act phase. Consider what the students already know and identify the steps that need to be taken to reach the level required. How could you facilitate students’ understanding at each step? What investigations could be designed to build the skills at each step?
Read more about using the LIA FrameworkFollowing an investigation, the Integrate routine provides time and space for data to be evaluated and insights to be synthesized. It reveals new insights, consolidates and refines representations, generalises context and broadens students’ perspectives. It allows student thinking to become visible and opens formative feedback opportunities. It may also lead to further questions being asked, allowing the Inquire phase to start again.
When designing a teaching sequence, consider the diagnostic assessment that was undertaken during the Launch phase. Consider if alternative conceptions could be used as a jumping off point to discussions. How could students represent their learning in a way that would support formative feedback opportunities? Could small summative assessment occur at different stages in the teaching sequence?
Read more about using the LIA FrameworkGraphing speed
(Slide 18) Compare the two graphs, noting that there are fewer columns on the second (fast walking) graph and that the columns are taller. Discuss how a person travelling faster moves a longer distance during each time period.
Potential discussion prompts
- Is this what you expected the graph to look like?
- How is this graph different to the first graph?
- The columns are taller, and there are fewer of them.
- Why are the columns longer?
- The Walker travelled further during each time period.
- During which time period did the Walker travel the fastest?
- During which time period did the Walker travel the slowest?
- How could we calculate the average speed of the Walker during this investigation?
✎ STUDENT NOTES: Answer the discussion questions on the Measuring speed Resource sheet.
Discuss how speed was defined in the last lesson as the distance travelled per unit of time, but it can also mean that someone takes less time to travel the same distance.
- How did we define speed in the last lesson? Can you explain it in your own words?
- In a 100 m running race, one person finishes in 15 seconds, while another person finishes in 11 seconds. Who wins the race? Why do you say that?
- When running the same distance, the person who runs the shortest time wins.
- What does it mean to “take less time to travel the same distance”? How is that related to speed?
- If your speed doubles, does it take you more or less time to travel the same distance?
(Slide 19) Draw a table with two columns: ‘High speed/Fast’ and ‘Low speed/Slow’. Discuss with students where each of the following should be placed:
- Takes longer to travel 10 m
- Takes less time to travel 10 m
- Travels further in 10 s
- Travels a shorter distance in 10 s
✎ STUDENT NOTES: Students add the completed table in their notes.
| High speed/Fast | Low speed/Slow |
| Takes less time to travel 10 m | Takes longer to travel 10 m |
| Travels further distance in 10 s | Travels a shorter distance in 10 s |
Discuss how autonomous cars control the speed they travel. Some cars use GPS to measure how far they have travelled in a set time period. This is used to calculate their speed.
Pose the question: What happens if the internet connection is not reliable? Could this affect the speed of the car?
Discuss how autonomous cars may need to maintain their ‘current’ speed when driving in remote areas. This may be done by measuring the speed the wheels turn and sending the data to the control module. When this changes, the autonomous car sends information to the throttle so that the speed is maintained.
Reflect on the lesson
You might invite students to:
- research the way non-autonomous cars measure their speed (for the speedometer).
- explain the relationship between speed, distance and time in their own words.
- research how autonomous cars use GPS to measure speed.
Scalar quantities vs vectors
In motion, quantities can be classified as scalar or vector.
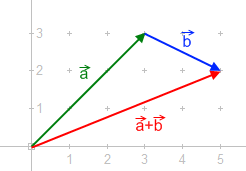
In motion, quantities can be classified as scalar or vector, depending on whether or not they include direction as part of the information. Scalar quantities describe how much of something there is—such as distance, speed, time, or mass—without indicating the direction in which it is moving. In contrast, vector quantities provide more complete information about motion by including direction, such as velocity, displacement, acceleration, and force. For example:
- a car travelling 100 km is a scalar distance, but if it moves 100 km north, that is a vector displacement.
- if a person travelled 3 km east and then turned around and travelled 3 km west (returning to their starting point), the total distance travelled is 6 km, while the displacement (distance from their point of origin) is 0 km.
Understanding the difference between scalar and vector quantities is crucial to ensure the correct terminology is used in the classroom and to prevent students from developing alternative conceptions.