

Forces and sport
View Sequence overviewStudents will:
- conduct an investigation to determine how different surfaces change the amount of friction an object experiences while it is moving.
- describe friction as a force that opposes relative motion and explain why friction occurs.
- apply their understanding to describe and classify examples of friction in sport.
Students will represent their understanding as they:
- plan and conduct an investigation to determine the frictional force of different surfaces on an object.
- analyse the results and draw valid conclusions.
- use argumentation to provide an informed decision about the surface suitable for a sport scenario.
In this lesson, assessment is formative.
Feedback might focus on students’ ability to:
- describe the relationship between frictional force and different surfaces.
- explain why friction occurs.
- label frictional force on a force diagram.
- complete an investigation and record data.
- transform data by calculating averages.
- analyse data to describe trends and patterns.
- assess the precision of data, identify possible errors and improvements to minimise errors.
Potential summative assessment
Students working at the Achievement Standard should:
- represent and explain the effects of forces acting on objects.
- conduct safe, reproducible investigations to test relationships.
- use equipment to generate and record data with precision.
- process data and information and analyse it to describe patterns, trends and relationships.
- identify possible sources of error.
- identify evidence to support their conclusions and construct evidence-based arguments.
Refer to the Australian Curriculum content links on the Our design decisions tab for further information.
Whole class
Forces and sport Slides
Each group
500g mass
Wooden block with hook embedded in one end
A range of Newton meters e.g. 5 N, 10 N and 20 N or a digital meter
Different surfaces to pull the block and mass across, such as: carpet, plastic, rubber, laminate, concrete, bitumen, metal, gravel, mulch, sandpaper, dowel rods, wax paper, towel, wood
Materials to reduce friction like vegetable oil or pieces of dowel
Table or other flat surface e.g. lab bench
Each student
Individual science notebook
Forces and sport Poster
Friction and motion investigation planner Resource sheet
Lesson
The Inquire phase allows students to cycle progressively and with increasing complexity through the key science ideas related to the core concepts. Each Inquire cycle is divided into three teaching and learning routines that allow students to systematically build their knowledge and skills in science and incorporate this into their current understanding of the world.
When designing a teaching sequence, it is important to consider the knowledge and skills that students will need in the final Act phase. Consider what the students already know and identify the steps that need to be taken to reach the level required. How could you facilitate students’ understanding at each step? What investigations could be designed to build the skills at each step?
Read more about using the LIA FrameworkRe-orient
Recall the previous lesson, focusing on the effect of increasing the force applied on the motion of an object.
Recall the links made to sport where increased force can be used to increase speed, increase distance, stop motion, or suddenly change its direction.
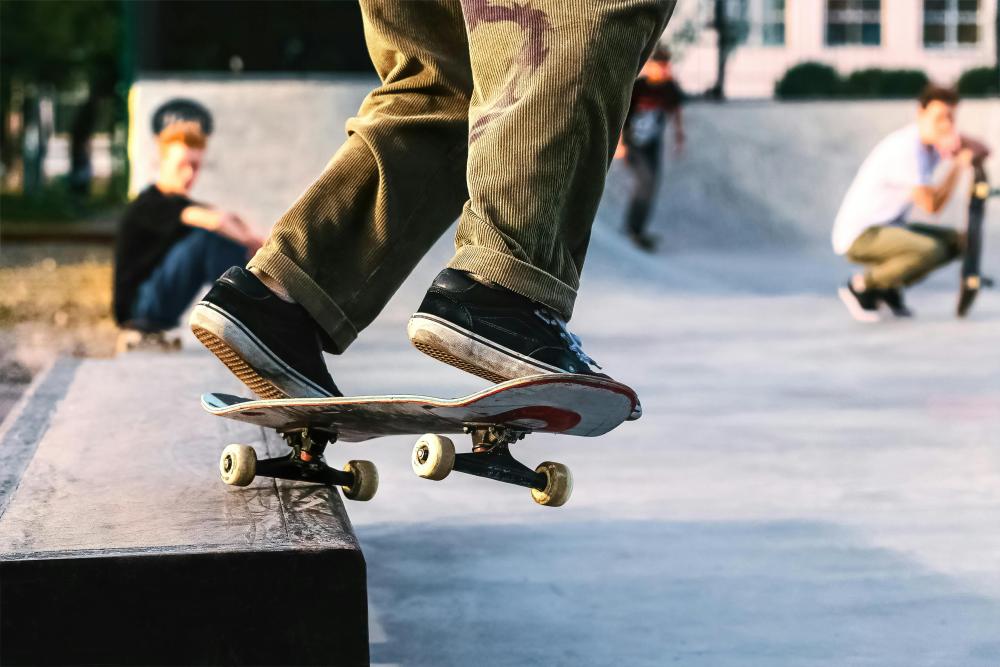
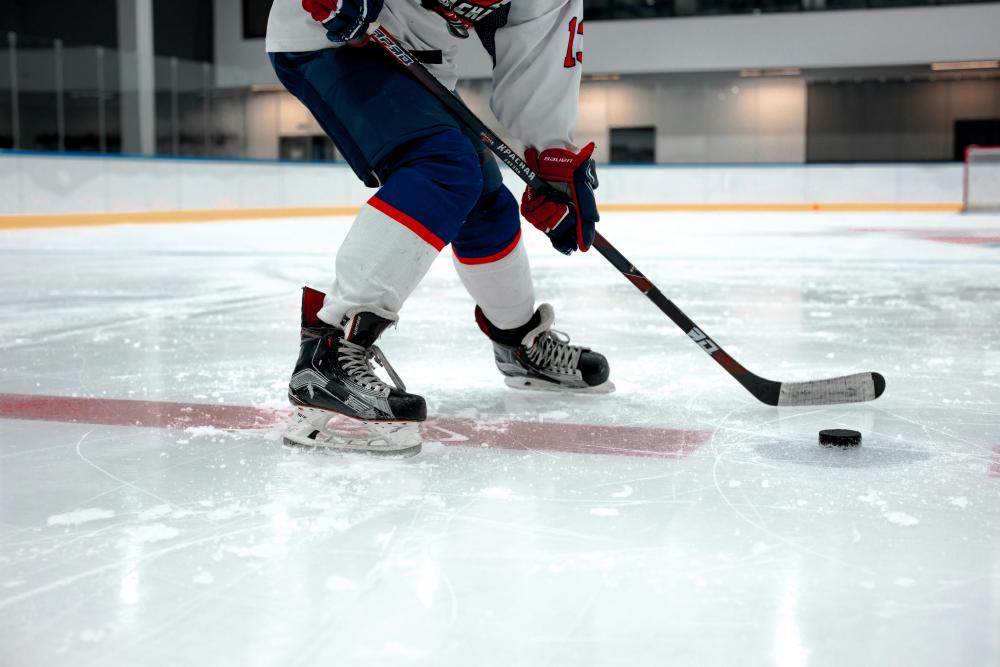
(Slide 48) Explain that the four images on the slide each show how increasing the amount of force applied can affect the motion of a person or object. Discuss how the images are similar or different.
Examine the Forces and sport Poster and invite students to:
- identify two examples of sports where increasing force can increase speed or distance.
- identify two examples of sports where increasing force can lead to stopping motion or suddenly changing direction.
Compare and contrast
Asking students to identify similarities and differences is considered a higher-order thinking skill.
The process of comparing and contrasting engages cognitive skills such as categorising, recognising relationships, and making judgements, rather than simply repeating information.
Students may need scaffolding and support to do this skill successfully. Students must understand each concept well enough to recognise key features, decide which features are important, and then organise their thinking to justify how and why items are alike or different. Suggested support structures include:
- activating prior knowledge first.
- providing comparison categories or criteria.
- modelling the process.
- using sentence starters or visual supports like a T-chart or Venn diagram.
- encouraging evidence-based reasoning by prompting students to justify their judgements using examples or observations.
- encouraging students to refine their thinking by learning from others, through listening in small group structures and talking through ideas.
By engaging in this thinking routine, students build a deeper conceptual understanding and develop the skills of identifying patterns. Teachers can also receive valuable formative feedback of students’ understanding of the topic, often masked when students only engage in recall activities.
The process of comparing and contrasting engages cognitive skills such as categorising, recognising relationships, and making judgements, rather than simply repeating information.
Students may need scaffolding and support to do this skill successfully. Students must understand each concept well enough to recognise key features, decide which features are important, and then organise their thinking to justify how and why items are alike or different. Suggested support structures include:
- activating prior knowledge first.
- providing comparison categories or criteria.
- modelling the process.
- using sentence starters or visual supports like a T-chart or Venn diagram.
- encouraging evidence-based reasoning by prompting students to justify their judgements using examples or observations.
- encouraging students to refine their thinking by learning from others, through listening in small group structures and talking through ideas.
By engaging in this thinking routine, students build a deeper conceptual understanding and develop the skills of identifying patterns. Teachers can also receive valuable formative feedback of students’ understanding of the topic, often masked when students only engage in recall activities.
The Inquire phase allows students to cycle progressively and with increasing complexity through the key science ideas related to the core concepts. Each Inquire cycle is divided into three teaching and learning routines that allow students to systematically build their knowledge and skills in science and incorporate this into their current understanding of the world.
When designing a teaching sequence, it is important to consider the knowledge and skills that students will need in the final Act phase. Consider what the students already know and identify the steps that need to be taken to reach the level required. How could you facilitate students’ understanding at each step? What investigations could be designed to build the skills at each step?
Read more about using the LIA FrameworkIdentifying and constructing questions is the creative driver of the inquiry process. It allows students to explore what they know and how they know it. During the Inquire phase of the LIA Framework, the Question routine allows for past activities to be reviewed and to set the scene for the investigation that students will undertake. The use of effective questioning techniques can influence students’ view and interpretation of upcoming content, open them to exploration and link to their current interests and science capital.
When designing a teaching sequence, it is important to spend some time considering the mindset of students at the start of each Inquire phase. What do you want students to be thinking about, what do they already know and what is the best way for them to approach the task? What might tap into their curiosity?
Read more about using the LIA FrameworkSurfaces in sport and physical activities
(Slide 49) Explain that in this lesson students will explore how different surfaces affect motion. Collect student ideas using the slide images to answer the question: Why are surfaces important in cycling?.
(Slide 50) Point out to students that an explanation is needed to answer this question and the response requires certain features to be included. Model how to provide an explanation.
Questions, such as those below, can be used to model how students can think about and write a response.
- What is the verb in this question? What do you need to include in an answer to a “Why” question?
- “Why” is the verb. It requires the cause and the effect linked with a word like “because”.
- What do you already know about surfaces and bikes?
- Types of surfaces in cycling include:
- tyres on smooth bitumen roads, on rough gravel and on dirt.
- grip on handlebars.
- feet on rough pedals.
- bald tyres on road bikes, knobbly tyres on mountain bikes, brake blocks pushing on metal rims.
- You could also extend the discussion to include smooth clothing and helmet shapes.
- Types of surfaces in cycling include:
- What do you already know about the purpose of these surfaces? This will support the explanation.
- For example: The rough pedals stop shoes from slipping, knobbly tyres grip gravel and dirt roads, slick road cycling tyres minimise gripping when riding on bitumen roads so the rider can go faster.
- To finish answering the question, generalise what you have discovered into one sentence.
- For example: Rough surfaces slow or stop motion and stop slipping and sliding, slick or smooth surfaces allow motion.
(Slide 51) Students build on the teacher’s model answer by brainstorming examples in sport and physical activities where two surfaces are in contact and:
- equipment moving across a surface slows down (such as a hockey ball or sliding object slowing down on a surface).
- equipment in contact with another surface grips (such as spiked football shoes, track shoes or shoes for basketball, netball, or badminton on a court surface where quick changes of direction are needed).
- equipment in contact with another surface slides (such as the grip on the handle of a tennis racket or swimsuit to stop drag in water and to slide through the water)
(Slide 52) Pose the question: Why are surfaces important in sport or physical activities?
Invite feedback from the brainstorming, noting key ideas to include when answering the question at the end of the lesson.
The Inquire phase allows students to cycle progressively and with increasing complexity through the key science ideas related to the core concepts. Each Inquire cycle is divided into three teaching and learning routines that allow students to systematically build their knowledge and skills in science and incorporate this into their current understanding of the world.
When designing a teaching sequence, it is important to consider the knowledge and skills that students will need in the final Act phase. Consider what the students already know and identify the steps that need to be taken to reach the level required. How could you facilitate students’ understanding at each step? What investigations could be designed to build the skills at each step?
Read more about using the LIA FrameworkThe Investigate routine provides students with an opportunity to explore the key ideas of science, to plan and conduct an investigation, and to gather and record data. The investigations are designed to systematically develop content knowledge and skills through increasingly complex processes of structured inquiry, guided inquiry and open inquiry approaches. Students are encouraged to process data to identify trends and patterns and link them to the real-world context of the teaching sequence.
When designing a teaching sequence, consider the diagnostic assessment (Launch phase) that identified the alternative conceptions that students held. Are there activities that challenge these ideas and provide openings for discussion? What content knowledge and skills do students need to be able to complete the final (Act phase) task? How could you systematically build these through the investigation routines? Are there opportunities to build students’ understanding and skills in the science inquiry processes through the successive investigations?
Read more about using the LIA FrameworkInvestigating friction
Provide students with a copy of the Friction and motion investigation planner Resource sheet.
(Slide 53) Explain that the force that can affect motion when two surfaces are in contact is called “friction”. Define friction: Friction is a contact force that occurs when two surfaces touch and resist slipping or sliding when one surface moves, or tries to move, relative to the other.
✎STUDENT NOTES: Write the definition for friction (Question 1).
(Slide 54) Introduce the investigation that will try to answer the question: Why are surfaces important in sport or physical activities?
Demonstrate the equipment and different surfaces by:
- displaying the block of wood, 500g mass, and the Newton meter that will be used to measure the force needed to pull the block and mass.
- displaying or outlining the different types of surfaces the block will travel on, e.g. oil, dowel, carpet, plastic, rubber, laminate, concrete, bitumen, metal, gravel, mulch, sandpaper, wax paper, towel, wood.
- placing the mass on the block and attaching the Newton meter, then showing the action of pulling the block at a steady speed.
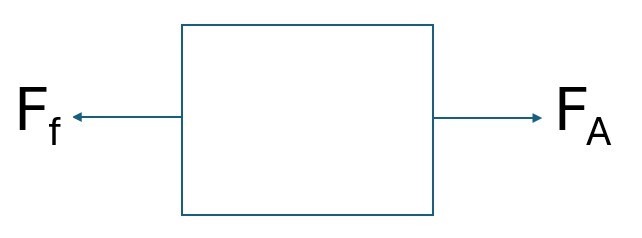
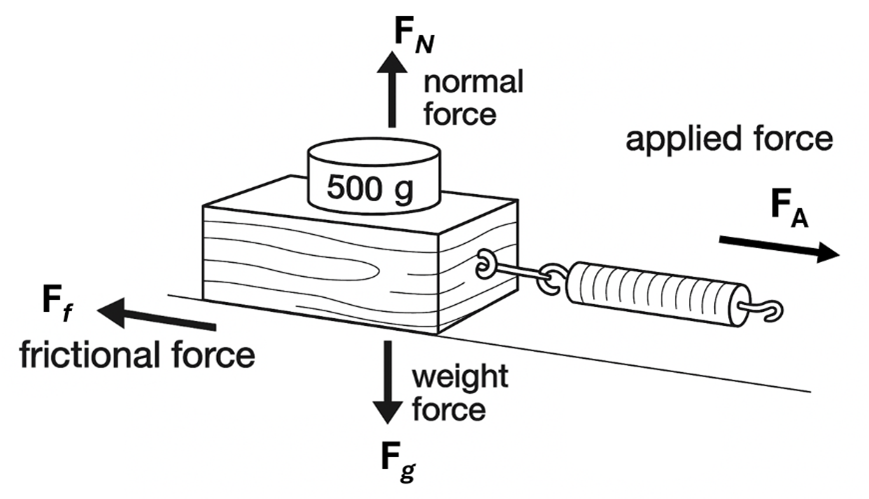
- Explain that by pulling the block at a constant speed, the frictional force is balanced with the applied pulling force. Remind students that this balance can be represented using equal-length force arrows, as shown in the image and in the force diagram below. The balanced forces mean the reading on the Newton meter will be the frictional force.
Read the aim of the investigation: To determine the effect of different surfaces on the force required to pull a block. Discuss how a research question is the big question that the investigation is trying to answer.
✎STUDENT NOTES: Write a research question for the investigation (Question 2).
Invite pairs of students to give feedback on each other’s questions using the criteria:
- Does it start with a word such as “Does…”, “How...”, “Why…” or “How…”?
- Does it include what will change, what will be measured, and why the investigation is being completed?
✎STUDENT NOTES: Draw a force diagram to represent the applied force and frictional force acting on a block being pulled at a constant speed (Question 3).
Discuss the meanings of “independent variable” and “dependent variable”. Ask students to identify the independent and dependent variables of this investigation, using the aim of the investigation as a reference.
✎STUDENT NOTES: Identify the independent and dependent variables for this investigation (Question 4).
As a class, brainstorm all the factors that could affect the reading on the Newton meter and why each factor could affect the reading. This may include:
- the speed the meter is being pulled (as it could be too fast for the other team members to take a reading).
- the steadiness of the pulling of the meter.
- the distance the meter will be pulled.
- the time at which the reading will be taken.
- the person taking the reading.
- whether the same wooden block is used.
Discuss why these variables need to be controlled.
✎STUDENT NOTES: Complete the planning for the investigation, including the controlled variables, hypothesis, procedure, and risk assessment (Questions 4 & 5).
Allow students time to conduct the experiment.
✎STUDENT NOTES: Record results in a results table (Question 6).
Defining friction
Emphasising friction as an interaction that resists relative motion, rather than simply one that slows moving objects, helps students develop a more accurate, transferable understanding.
In this lesson sequence, all forces are described as interactions between objects that affect motion, emphasising that forces do not exist in isolation. A force is not something an object has; rather, it arises from an interaction between two objects. The definition of friction used in the Slides (Slide 53) is intentionally worded to reflect this understanding. It makes explicit both the interacting objects (two surfaces touch) and the effect of the interaction on motion (resist slipping or sliding when one surface moves), rather than presenting friction as resistance or a property belonging to an object.
The phrasing moves, or tries to move, relative to the other is also deliberate. Without this wording, students may develop the misconception that friction only acts on objects that are already moving and that its sole role is to slow motion. Such a narrow definition fails to capture many real-world and sporting contexts—for example, when athletes push against a track, court or field—where friction is critical because it prevents slipping rather than opposing motion. By explicitly including situations in which motion is attempted but does not occur, the definition highlights that friction acts whenever two surfaces attempt to slide relative to each other.
In this lesson sequence, all forces are described as interactions between objects that affect motion, emphasising that forces do not exist in isolation. A force is not something an object has; rather, it arises from an interaction between two objects. The definition of friction used in the Slides (Slide 53) is intentionally worded to reflect this understanding. It makes explicit both the interacting objects (two surfaces touch) and the effect of the interaction on motion (resist slipping or sliding when one surface moves), rather than presenting friction as resistance or a property belonging to an object.
The phrasing moves, or tries to move, relative to the other is also deliberate. Without this wording, students may develop the misconception that friction only acts on objects that are already moving and that its sole role is to slow motion. Such a narrow definition fails to capture many real-world and sporting contexts—for example, when athletes push against a track, court or field—where friction is critical because it prevents slipping rather than opposing motion. By explicitly including situations in which motion is attempted but does not occur, the definition highlights that friction acts whenever two surfaces attempt to slide relative to each other.
Adapting force diagrams for your context
Teachers are encouraged to adapt the force diagrams used in this lesson to suit their specific teaching context and their students’ prior learning.
The force diagrams in this lesson align with the focus on horizontal forces from previous lessons. If students have been introduced to normal force and weight force, encourage them to include these forces in their diagrams to create a more complete representation.
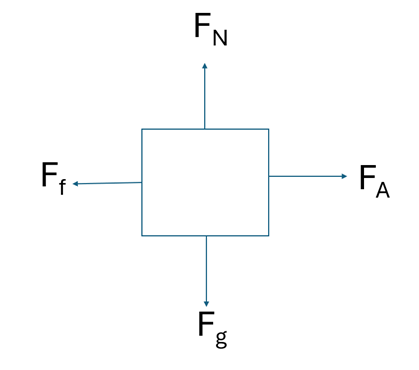
Being flexible with diagrams supports coherence across the unit by allowing students to build on existing knowledge, rather than treating each lesson in isolation. Teachers may also choose to simplify or extend the diagrams depending on student readiness, focusing on the forces most relevant to the learning goals. Adapting the diagrams in this way reinforces that force diagrams are thinking tools used to represent interactions, not rigid drawings that must always look the same.
The force diagrams in this lesson align with the focus on horizontal forces from previous lessons. If students have been introduced to normal force and weight force, encourage them to include these forces in their diagrams to create a more complete representation.
Being flexible with diagrams supports coherence across the unit by allowing students to build on existing knowledge, rather than treating each lesson in isolation. Teachers may also choose to simplify or extend the diagrams depending on student readiness, focusing on the forces most relevant to the learning goals. Adapting the diagrams in this way reinforces that force diagrams are thinking tools used to represent interactions, not rigid drawings that must always look the same.
Deliberate design choices to support student learning
Deliberate design choices support students’ conceptual understanding while progressively building their scientific inquiry skills.
The design of this investigation reflects a deliberate effort to support students’ developing conceptual understanding and inquiry skills. Rather than measuring the force required to start the block moving, students measure the force while the block is moving at a constant speed. This approach allows the Newton meter reading to be directly related to the frictional force, as the applied force and frictional force are balanced. The investigation therefore reinforces students’ understanding of balanced and unbalanced forces while providing a meaningful context for revisiting force diagrams. It also reduces some of the practical difficulties Year 7 students can experience when trying to read a Newton meter at the instant an object begins to move, enabling them to focus on careful observation and accurate data collection.
The investigation has also been designed to progressively develop students’ ability to organise, represent and analyse data. The collected data provides opportunities to discuss reliability, variation and sources of error, supporting students to move beyond simply gathering measurements and towards evaluating evidence. Students organise their data in a results table and use these data to construct a scatter plot with a line of best fit. While students have previously been supported to interpret tables and graphs throughout the sequence, this is the first time they create their own graph. This reflects the gradual progression of graphing skills across the sequence, moving students from interpreting teacher-provided graphs to creating their own representations of data.
The design of this investigation reflects a deliberate effort to support students’ developing conceptual understanding and inquiry skills. Rather than measuring the force required to start the block moving, students measure the force while the block is moving at a constant speed. This approach allows the Newton meter reading to be directly related to the frictional force, as the applied force and frictional force are balanced. The investigation therefore reinforces students’ understanding of balanced and unbalanced forces while providing a meaningful context for revisiting force diagrams. It also reduces some of the practical difficulties Year 7 students can experience when trying to read a Newton meter at the instant an object begins to move, enabling them to focus on careful observation and accurate data collection.
The investigation has also been designed to progressively develop students’ ability to organise, represent and analyse data. The collected data provides opportunities to discuss reliability, variation and sources of error, supporting students to move beyond simply gathering measurements and towards evaluating evidence. Students organise their data in a results table and use these data to construct a scatter plot with a line of best fit. While students have previously been supported to interpret tables and graphs throughout the sequence, this is the first time they create their own graph. This reflects the gradual progression of graphing skills across the sequence, moving students from interpreting teacher-provided graphs to creating their own representations of data.
The Inquire phase allows students to cycle progressively and with increasing complexity through the key science ideas related to the core concepts. Each Inquire cycle is divided into three teaching and learning routines that allow students to systematically build their knowledge and skills in science and incorporate this into their current understanding of the world.
When designing a teaching sequence, it is important to consider the knowledge and skills that students will need in the final Act phase. Consider what the students already know and identify the steps that need to be taken to reach the level required. How could you facilitate students’ understanding at each step? What investigations could be designed to build the skills at each step?
Read more about using the LIA FrameworkFollowing an investigation, the Integrate routine provides time and space for data to be evaluated and insights to be synthesized. It reveals new insights, consolidates and refines representations, generalises context and broadens students’ perspectives. It allows student thinking to become visible and opens formative feedback opportunities. It may also lead to further questions being asked, allowing the Inquire phase to start again.
When designing a teaching sequence, consider the diagnostic assessment that was undertaken during the Launch phase. Consider if alternative conceptions could be used as a jumping off point to discussions. How could students represent their learning in a way that would support formative feedback opportunities? Could small summative assessment occur at different stages in the teaching sequence?
Read more about using the LIA FrameworkUnderstanding and applying the investigation
(Slide 55) Compare the experimental results from each group and discuss the patterns found. Using the definition of friction, discuss why the same block experienced different frictional forces depending on the surface it was pulled across. Collate key ideas during the discussion and ask students to write an explanation. Co-construct the explanation or use sentence starters if students need support.
✎STUDENT NOTES: Complete the analysing results and conclusion questions (Questions 7 & 8).
Discuss the low and higher variation in the students’ data sets. Explain that when there is a high variation in the collected data between trials, then the experiment has low precision. Invite students to examine their data and reach a group consensus of the precision of their data.
Explain that random errors lead to variation in the collected data. Brainstorm possible errors that led to variation in the class data. Possible examples could be:
- surface irregularities.
- inconsistent contact between block and surface.
- the angle of pulling the Newton meter.
- changes in pull smoothness.
- the stretching and flexing of the spring in the Newton meter.
Select one error and discuss a possible improvement to how the experiment could be conducted to reduce the impact of their identified error.
✎STUDENT NOTES: Complete the remaining questions on the Friction and motion investigation planner Resource sheet.
(Slide 56) Re-pose the question asked at the start of the lesson: Why are surfaces important in sport or physical activities?
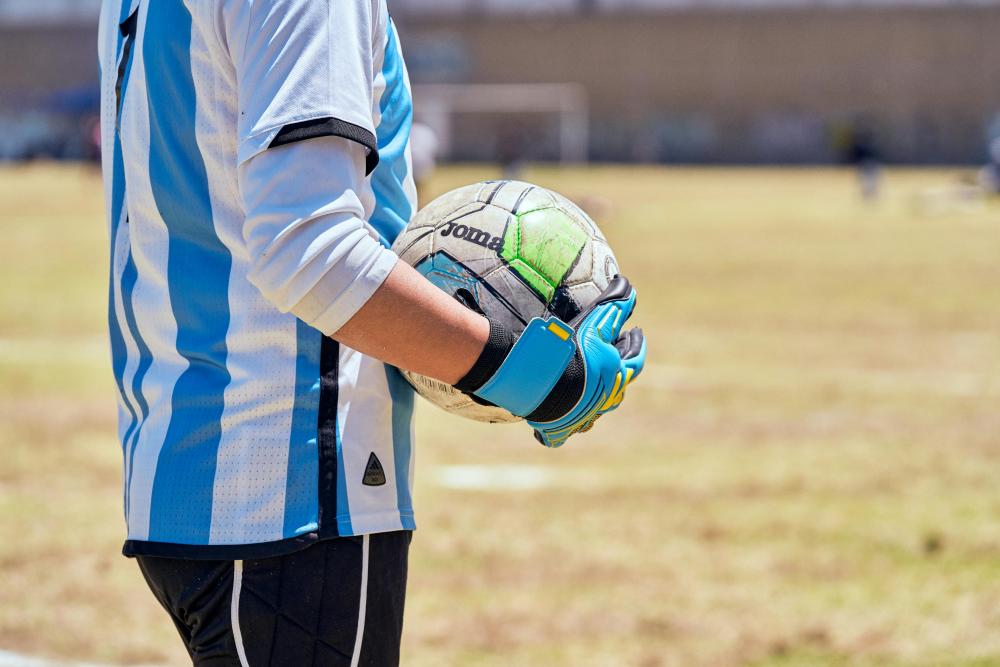
Referring to the results of the investigation, discuss how surfaces can reduce or increase the friction experienced and the different resulting changes in motion.
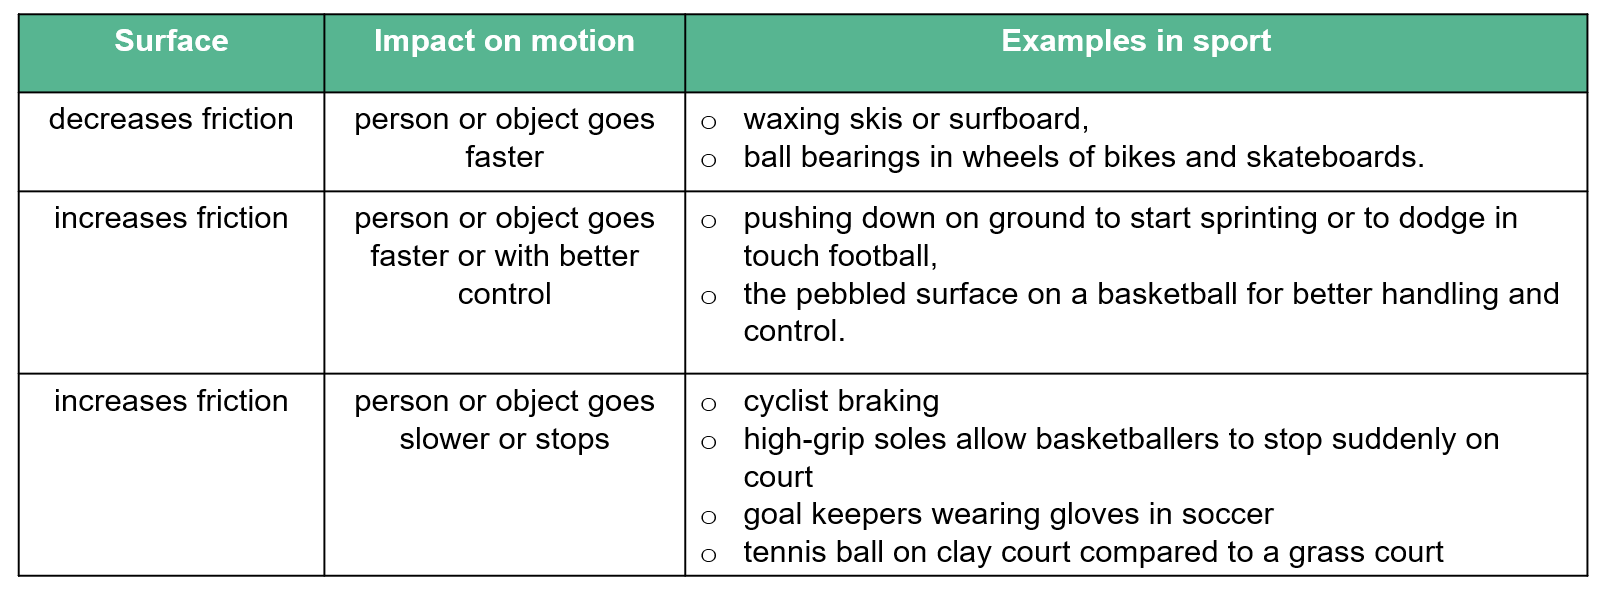
(Slide 57) Invite students to identify how the different surfaces in the pictures increase or reduce friction and the resulting impact on motion. Answers could include:
- Polished metal blades reduce friction and increase the speed of the bobsled.
- Aerodynamic helmets and “tucked-in” body position reduce air resistance or drag and allow the rider to go faster.
- Knobby tyres on motorbike wheels increase the surface area in contact with the ground and allow more grip in the muddy conditions. This increased friction allows the bike to accelerate faster around corners.
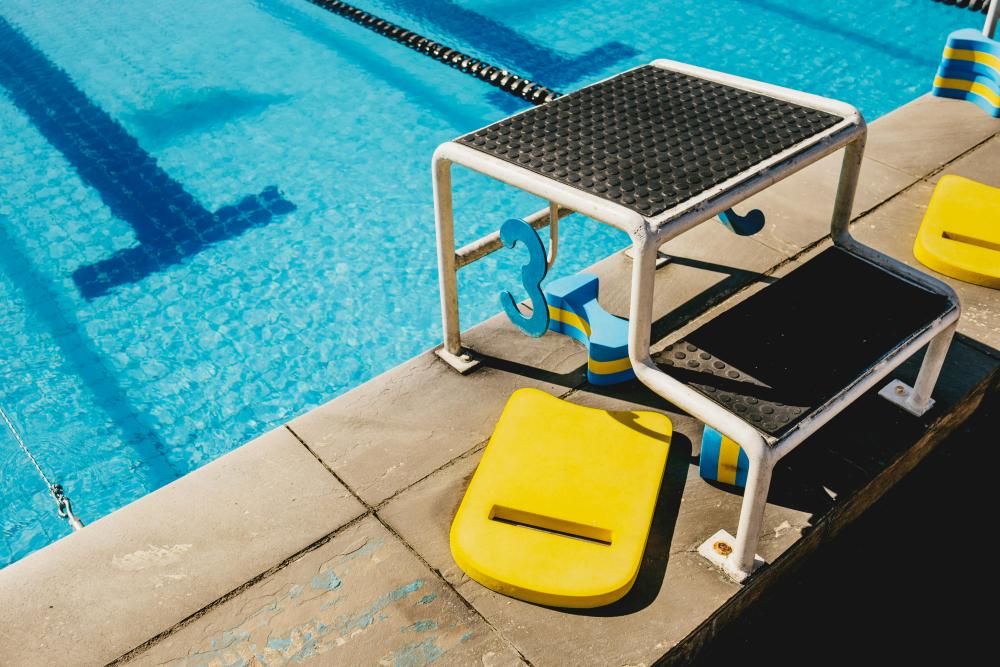
- The surfaces of gloves holding bar on wheelchair, rough surface of starting block, and specialised spike pads or soles on running blades increase friction and grip, allowing for increased acceleration.
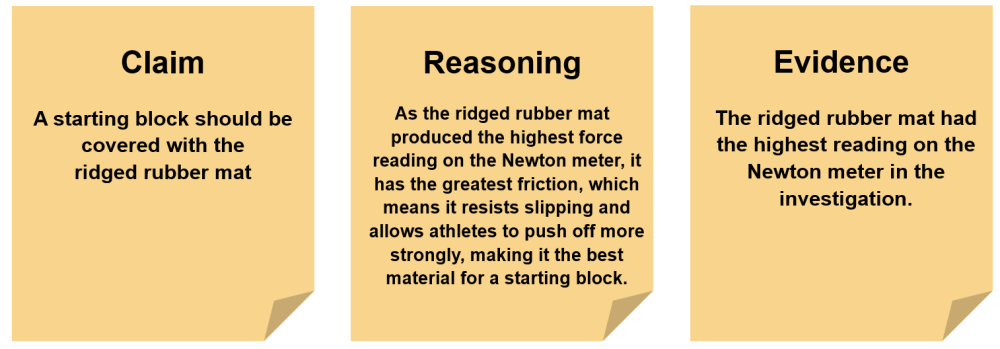
(Slide 58) Pose the question: What surface would be best for a starting block, and why?
Discuss how the movement of a swimmer, diver or sprinter after pushing off the starting block determines the most appropriate block surface.
(Slide 59) Encourage students to use argumentation to make a claim regarding an appropriate surface for a starting block, supported by evidence from the investigation and reasoning.
Discuss the student claims, encouraging students to make changes to clarify their evidence and reasoning.
An example response could be:
Reflect on the lesson
You might ask students to:
- review the learning goals for the lesson and check for understanding.
- reflect and write three things to add to their infographic in response to this lesson.
- add any new words to their glossary.
- represent three examples of horizontal motion in free-body diagrams using force arrows with labels. For a challenge add the magnitude of the force on the arrows. Ask another student to determine the direction (and magnitude if included) of net force.
- read about the wind tunnel testing of cyclists at the Canterbury University to find out what reduces drag. The article includes some data from the experiments as well.
Precision and reliability
Introducing terms such as “precision”, “reliability” and “error” helps Year 7 students develop scientifically accurate data analysis skills.

Variation in the collected data occurs because measurements are never the same each time, even when students try to keep everything consistent each trial. These small differences are caused by factors such as slight changes in how we use the equipment, limits in how precise the tools are, or natural differences in the conditions each time the test is repeated. For example:
- a quantity may be estimated because it lies between the graduations on a measuring device such as a ruler, thermometer or measuring cylinder.
- an experimenter will try to take into account parallax error when measuring 20 mL of water in a 25 mL measuring cylinder but there will always be variation in this measurement which may impact the measurement of the dependent variable. An experimenter’s variation in reaction time when using a stopwatch is also an example.
- through the bias of the experimenter.
- by the surrounding environment such as temperature, wind or the interference of electromagnetic waves or vibrations with sensitive equipment.
The difference between the measured value and the true value is called “error”. Errors due to the factors described above are called “random errors”.
Precision and reliability
Asking students to assess the variation in their collected data is also called assessing the precision of the data. Students will assess the extent to which multiple measurements, or trials, made under identical or similar conditions, agree with each other.
When assessing the reliability of an experiment, students would assess the extent to which the findings of repeated experiments at different times or locations, conducted under identical or similar conditions, agree with each other. Student groups comparing their findings with other student groups in the classroom would be an example of this process.
Variation in the collected data occurs because measurements are never the same each time, even when students try to keep everything consistent each trial. These small differences are caused by factors such as slight changes in how we use the equipment, limits in how precise the tools are, or natural differences in the conditions each time the test is repeated. For example:
- a quantity may be estimated because it lies between the graduations on a measuring device such as a ruler, thermometer or measuring cylinder.
- an experimenter will try to take into account parallax error when measuring 20 mL of water in a 25 mL measuring cylinder but there will always be variation in this measurement which may impact the measurement of the dependent variable. An experimenter’s variation in reaction time when using a stopwatch is also an example.
- through the bias of the experimenter.
- by the surrounding environment such as temperature, wind or the interference of electromagnetic waves or vibrations with sensitive equipment.
The difference between the measured value and the true value is called “error”. Errors due to the factors described above are called “random errors”.
Precision and reliability
Asking students to assess the variation in their collected data is also called assessing the precision of the data. Students will assess the extent to which multiple measurements, or trials, made under identical or similar conditions, agree with each other.
When assessing the reliability of an experiment, students would assess the extent to which the findings of repeated experiments at different times or locations, conducted under identical or similar conditions, agree with each other. Student groups comparing their findings with other student groups in the classroom would be an example of this process.
Argumentation
The argumentation activity in this lesson allows students to construct evidence-based arguments to evaluate claims.
Argumentation is the process of systematically providing reasoning to support a claim. Unlike the commonly used negative term “argument”, argumentation involves developing a valid argument or persuasive idea.
At the simplest level, students should be able to provide a claim, evidence and reasoning.
Claim: Ridged rubber is the best material for a sprinter’s starting block
Reasoning: The sprinter needs their foot to be gripped but not tightly held as they push down on the block so they can push off and accelerate quickly.
Evidence: The ridged rubber mat gave a reading of 3.8 N on the Newton meter, which showed this surface had a high frictional force.
More advanced students will be able to identify:
- Limitations: The limitations of the data.
- Backing: The assumptions made in the data.
- Counter-claim: An answer to alternative claims.
Argumentation is the process of systematically providing reasoning to support a claim. Unlike the commonly used negative term “argument”, argumentation involves developing a valid argument or persuasive idea.
At the simplest level, students should be able to provide a claim, evidence and reasoning.
Claim: Ridged rubber is the best material for a sprinter’s starting block
Reasoning: The sprinter needs their foot to be gripped but not tightly held as they push down on the block so they can push off and accelerate quickly.
Evidence: The ridged rubber mat gave a reading of 3.8 N on the Newton meter, which showed this surface had a high frictional force.
More advanced students will be able to identify:
- Limitations: The limitations of the data.
- Backing: The assumptions made in the data.
- Counter-claim: An answer to alternative claims.