Tectonic collision course
View Sequence overviewStudents will:
- physically model the movement of a tsunami wave.
- develop and test a hypothesis on the effects of a tsunami wave arriving at high tide or low tide.
- use secondary data to graph the arrival of tsunami waves at low tide.
- compare physical and mathematical models.
Students will represent their understanding as they:
- use previous experience to develop a hypothesis of the impact of a tsunami at low and high tide.
- evaluate the accuracy of their hypothesis.
- use a large data set to generate a line graph of tidal heights and identify anomalies.
In this lesson, assessment is formative.
Feedback might focus on students’ ability to:
- use previous experience to develop a hypothesis.
- use data spreadsheets to generate an appropriate line graph.
- analyse a line graph to identify anomalies in tidal height.
- evaluate claims made as a result of a hypothesis.
Potential summative task
Students working at the achievement standard should:
- evaluate the impact of tectonic events on human populations.
- understand the use of tsunami sensors to reduce the impact of tectonic events.
- develop reasoned predictions and hypotheses to explore scientific models, identify patterns, and test relationships.
- use visual displays of large data sets to identify temporal and spatial relationships.
- constructing graphs using correct conventions, such as naming the graph and labelling the axes.
- analyse data and information to describe patterns, trends and relationships and identify anomalies.
Whole class
Tectonic collision course Resource PowerPoint
A tsunami wave tank prepared prior to the lesson according to the directions in the Preparing for this sequence tab
Tsunami wave tank
Large clear container or fish tank
Sand or soil to model beach zone
Metal or wooden plank the same width as the tank
String connected to one end of the plank
Duct tape
Water to fill the tank halfway
Cloth to dry the sides of the tank
8 x filter paper
Sticky tape
Permanent markers
Optional: food dye
Access to the following videos showing tsunamis with different causes:
- 1960 Chilean earthquake-generated tsunami (0:42)
- Tsunami caused by landslide (2:03)
- Tsunami caused by volcanic sources (2:42)
- Tsunami caused by earthquakes (2:46)
Each student
Individual science notebook
One of the following options:
- Vardon Harbour tide level Data resource and access to spreadsheet software
- Pages 26-27 of the Tsunami - student activities booklet from Geoscience Australia
Optional: Pages 24-25 of the Tsunami - student activities booklet from Geoscience Australia
Lesson
Re-orient
Recall the previous lesson focusing on the magnitude of earthquakes.
Discuss the location of the plate boundaries and how many of them are located under the oceans.
The Inquire phase allows students to cycle progressively and with increasing complexity through the key science ideas related to the core concepts. Each Inquire cycle is divided into three teaching and learning routines that allow students to systematically build their knowledge and skills in science and incorporate this into their current understanding of the world.
When designing a teaching sequence, it is important to consider the knowledge and skills that students will need in the final Act phase. Consider what the students already know and identify the steps that need to be taken to reach the level required. How could you facilitate students’ understanding at each step? What investigations could be designed to build the skills at each step?
Read more about using the LIA FrameworkIdentifying and constructing questions is the creative driver of the inquiry process. It allows students to explore what they know and how they know it. During the Inquire phase of the LIA Framework, the Question routine allows for past activities to be reviewed and to set the scene for the investigation that students will undertake. The use of effective questioning techniques can influence students’ view and interpretation of upcoming content, open them to exploration and link to their current interests and science capital.
When designing a teaching sequence, it is important to spend some time considering the mindset of students at the start of each Inquire phase. What do you want students to be thinking about, what do they already know and what is the best way for them to approach the task? What might tap into their curiosity?
Read more about using the LIA FrameworkAustralian impact
Discuss how Australia does not have many large earthquakes.
(Slide 37) Pose the question: Do we need to know about earthquakes in other parts of the world?
Show 1960 Chilean earthquake-generated tsunami (0:42).
The Inquire phase allows students to cycle progressively and with increasing complexity through the key science ideas related to the core concepts. Each Inquire cycle is divided into three teaching and learning routines that allow students to systematically build their knowledge and skills in science and incorporate this into their current understanding of the world.
When designing a teaching sequence, it is important to consider the knowledge and skills that students will need in the final Act phase. Consider what the students already know and identify the steps that need to be taken to reach the level required. How could you facilitate students’ understanding at each step? What investigations could be designed to build the skills at each step?
Read more about using the LIA FrameworkThe Investigate routine provides students with an opportunity to explore the key ideas of science, to plan and conduct an investigation, and to gather and record data. The investigations are designed to systematically develop content knowledge and skills through increasingly complex processes of structured inquiry, guided inquiry and open inquiry approaches. Students are encouraged to process data to identify trends and patterns and link them to the real-world context of the teaching sequence.
When designing a teaching sequence, consider the diagnostic assessment (Launch phase) that identified the alternative conceptions that students held. Are there activities that challenge these ideas and provide openings for discussion? What content knowledge and skills do students need to be able to complete the final (Act phase) task? How could you systematically build these through the investigation routines? Are there opportunities to build students’ understanding and skills in the science inquiry processes through the successive investigations?
Read more about using the LIA FrameworkModelling tsunamis
(Slide 38) Add the water and (optional) dye to the prepared tsunami tank, to fill the tank halfway.
Carry out the tsunami tank demonstration described below.
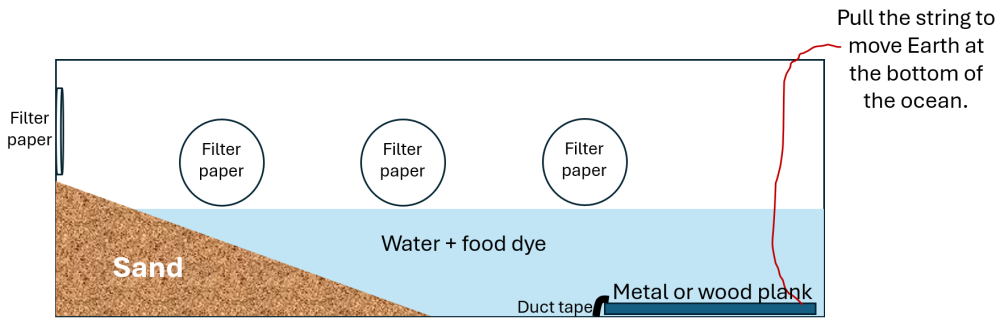
- Dry the sides of the tank.
- Use sticky tape to place the filter paper at different points along one side of the tank, just above the water level, and a final filter paper at the top of the sand ‘land’.
- Use the string to lift one end of the plank to model the tsunami wave.
- Have students use permanent markers to immediately mark the tsunami level on each filter paper.
Discuss how the tsunami waves (more than one) changed height at different locations along the tsunami tank, from small waves in deep water to taller waves as the water became shallower.
Watch the following videos demonstrating the three different causes of tsunamis:
- Tsunami caused by landslide (2:03)
- Tsunami caused by volcanic sources (2:42)
- Tsunami caused by earthquakes (2:46)
(Slide 39)✎ STUDENT NOTES: Define ‘tsunami’ as a series of powerful ocean waves caused by sudden displacements of water by earthquakes, landslides or volcanic activity.
(Slide 40) Pose the question: Does it make any difference if the tsunami waves arrive at high tide or low tide?
Remind students that tides are influenced by the Moon’s gravity.
Discuss how tides could be modelled using the water tsunami tank. Explain how this is a physical model designed to safely test the impacts of tsunamis. It also helps communicate the idea of tsunamis.
Allow students time to plan and suggest ways to model the impact of a tsunami at low or high tide.
Discuss how individuals in the class may need to mark the current depth of the water and the locations of the filter paper on the outside of the tank. Students should suggest that extra water be added to the tank to represent high tide, or water be removed from the tank to represent low tide. Use the cloth to dry the side of the tank before re-attaching fresh filter paper.
✎ STUDENT NOTES: Draw the tsunami tank and explain how the tsunami waves are modelled. Explain how high tide or low tide can be modelled.
Once agreement on the approach has been reached, allow time to complete the experimental model as a class.
Pose the question: What does this model not tell us?
Discuss how this physical model does not predict the effect of a tsunami on any particular beach.
Tsunamis
Tsunamis are very different from wind-generated surface waves.
All waves are described by their key characteristics:
- wavelength (distance between wave peaks)
- wave height (vertical distance from crest to trough)
- amplitude (half the wave height)
- velocity (speed of wave movement)
- period (time between successive wave peaks)
The highest point of a wave is the crest, and the lowest point is the trough. How these properties relate to one another depends on the way the wave is generated, its energy, and the environment it travels through.
Tsunamis are very different from wind-generated surface waves. They have extremely long wavelengths (up to 100–150 km) and long wave periods (5–90 minutes). In deep ocean water, tsunami wave heights are usually very small (often less than 50 cm), making them almost undetectable to ships. However, they can travel at very high speeds, 640–960 km/h, similar to a jet aircraft.
As a tsunami approaches shallow coastal waters, its speed decreases because wave speed depends on water depth. The rear of the wave continues moving faster than the front, causing the wave to compress and increase in height. This process is known as shoaling and typically occurs in water less than 100 m deep. As a result, a tsunami that was barely noticeable in deep water can grow to several metres high near the coast. Tsunamis usually arrive as a series of waves, and the first wave is not always the largest.
At the coast, a tsunami may appear as a breaking wave, a rapidly rising or falling sea level, or a fast-moving tide. The first sign may be either a rise or a fall in water level, depending on whether the crest or trough arrives first.
Phases of a tsunami
A tsunami progresses through four main phases:
- Generation – sudden displacement of water, usually by an earthquake.
- Propagation – wave energy spreads outward across the ocean.
- Shoaling – wave slows and grows in height in shallow water.
- Inundation – water flows onto land.
Coastal impact and amplification
The impact of a tsunami depends on the shape of the coastline, the depth and slope of the seafloor, and the local landscape. Narrow or funnel-shaped bays and harbours are especially at risk because they can trap and amplify the waves. Damage can also increase due to the seiche effect, where water sloshes back and forth in enclosed areas. Underwater canyons can direct and concentrate wave energy onto certain parts of the coast.
Two key ways scientists describe tsunami impact are:
- run-up — the highest point the water reaches above sea level.
- maximum inundation distance — how far inland the water travels.
Risk assessment and modelling
Predicting tsunami impacts is complex due to variable seafloor shape, wave interactions, reflections, and changing coastal features. Even small tsunamis can be dangerous because of strong currents and rapid water-level changes near shore.
To assess tsunami risk, scientists need information on:
- the location and likelihood of tsunami-generating events.
- the magnitude of those events.
- seafloor bathymetry.
- coastal topography.
Since the 2004 Indian Ocean tsunami, advanced computer modelling has been increasingly used to simulate tsunami generation, movement and inundation. These models support early warning systems, evacuation planning, and coastal development decisions, helping to reduce future risk.
The Inquire phase allows students to cycle progressively and with increasing complexity through the key science ideas related to the core concepts. Each Inquire cycle is divided into three teaching and learning routines that allow students to systematically build their knowledge and skills in science and incorporate this into their current understanding of the world.
When designing a teaching sequence, it is important to consider the knowledge and skills that students will need in the final Act phase. Consider what the students already know and identify the steps that need to be taken to reach the level required. How could you facilitate students’ understanding at each step? What investigations could be designed to build the skills at each step?
Read more about using the LIA FrameworkFollowing an investigation, the Integrate routine provides time and space for data to be evaluated and insights to be synthesized. It reveals new insights, consolidates and refines representations, generalises context and broadens students’ perspectives. It allows student thinking to become visible and opens formative feedback opportunities. It may also lead to further questions being asked, allowing the Inquire phase to start again.
When designing a teaching sequence, consider the diagnostic assessment that was undertaken during the Launch phase. Consider if alternative conceptions could be used as a jumping off point to discussions. How could students represent their learning in a way that would support formative feedback opportunities? Could small summative assessment occur at different stages in the teaching sequence?
Read more about using the LIA FrameworkHigher ground
Discuss how the tsunami waves came higher on the land during high tide, or lower on the land at low tide.
✎ STUDENT NOTES: Describe how the tsunami waves changed at high tide or low tide.
(Slide 41) Discuss how the magnitude of the event generating a tsunami (earthquake, landslide or volcanic activity) would affect the amount of water that would be displaced. Consider the need for sensitive sensors around the edges of tectonic plates to detect the displacement of water (noting that the water levels do not change as much in deep water).
- How does the magnitude of an earthquake influence the volume of water displaced during a tsunami-generating event?
- In what ways does a large landslide displace more water than a smaller one, even if both occur in the same location?
- What challenges arise when trying to detect small water-level changes in deep water?
- Why must sensors around tectonic plate boundaries be extremely sensitive?
- Why are tectonic plate edges key locations for placing water-displacement sensors?
- What could be the consequences of relying on sensors that are not sensitive enough?
- How might false positives or missed detections impact public trust in warning systems?
(Slide 42) Introduce the next activity: graphing and analysing the tidal levels at a fictional Vardon Harbour every 15 minutes. Discuss what would happen if tsunami waves landed during low tide or during high tide.
Allow students time to make a hypothesis of what would occur using evidence from the tsunami tank demonstration.
✎ STUDENT NOTES: Write a hypothesis of what would occur if a tsunami arrived at Vardon Harbour during low tide or high tide.
The following chart can either be generated using Vardon Harbour tide level Data resource and spreadsheet software (to support students to focus on the data analysis) or manually using pages 26-7 of Geoscience Australia’s Tsunami - student activities booklet (to support students to focus on plotting a graph).
Introduce the spreadsheet data from the Vardon Harbour tide level Data resource as the tidal measurements taken every 15 minutes from Vardon Harbour. Guide students to use the data to insert a line chart of the change in tidal levels over time. Allow students time to complete the graph, including labels for the axis and a title for the graph.
Alternatively, use the Tide chart recordings for Vardon Harbour data from page 26 of Tsunami - student activities booklet to hand-draw the tidal graph on page 27.
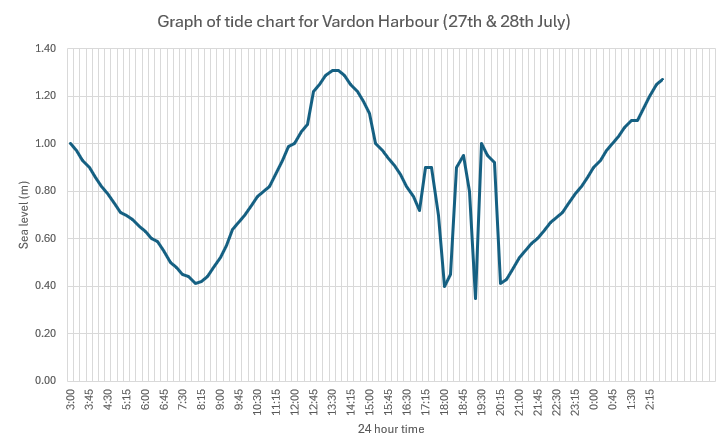
(Slide 43) In groups, analyse the graph by identifying the three anomalies in the graph and the time that they occurred. Discuss how these anomalies represent three tsunami waves that arrived at Vardon Harbour during low tide, and the possible consequences if they arrived during high tide.
- What is the normal high tide at Vardon Harbour? What time was this?
- 1.31 m, 13:30 (1:30 pm).
- What is the normal low tide at Vardon Harbour? What time was this?
- 0.41 m, 8:00 am.
- What is unusual about the graph?
- There are 3 ‘larger waves’ between 17:00-20:15.
- What do the three high sea level events represent?
- Tsunami waves.
- What should the normal tide movement look like during this time?
- How much higher is the sea level than it should be?
- Wave 1 is 0.2m higher. Wave 2 is 0.45 m higher. Wave 3 is 0.55 m higher.
- What would happen if these tsunami waves happened at high tide? How high would the water level be?
- The water level would be 1.2m, 1.75m, and 1.8m for each wave, respectively.
✎ STUDENT NOTES: Add a copy of the graph to your notes. Describe the normal pattern of high tide and low tide. Use the graph to describe how the low tide levels changed during 17:00-20:15 hours.
Optional: Complete the questions on pages 24 and 25 of Tsunami - student activities booklet.
Discuss the accuracy of students’ hypotheses.
✎ STUDENT NOTES: Write a reflection on the accuracy of your hypothesis of the impact of tsunami waves during high or low tide.
Discuss the importance of communicating tsunami warnings to people who live on the coast of Australia, and how this mathematical model might be able to provide more useful information than the physical model.
Reflect on the lesson.
You might ask students to:
- play the Stop Disasters game created by the United Nations Office for Disaster Risk Reduction.
- research the location of tsunami warning sensors.
- research how tsunami warning sensors work.
- research the work done by scientists from Geoscience Australia and Bureau of Meteorology who work as part of the Joint Australian Tsunami Warning Centre.