Tectonic collision course
View Sequence overviewStudents will:
- understand and identify the different types of earthquake waves.
- compare the advantages and limitations of three different models of earthquakes.
Students will represent their understanding as they:
- identify the transfer of energy in the different types of earthquake waves.
- describe how liquefaction affects structures during an earthquake.
- identify the P and S wave on a seismogram.
- use the P-S time from three stations to identify the location of the epicentre.
- identify the advantages and limitations of different earthquake models.
In this lesson, assessment is formative.
Feedback might focus on students’ ability to:
- model the different types of earthquake waves.
- identify the different types of earthquake waves from a seismograph.
- describe liquefaction.
- use seismographs to identify the epicentre of an earthquake.
- identify the advantages and limitations of different models.
Potential summative assessment
Students working at standard should:
- use visual displays of large data sets, such as maps.
- show the location of earthquakes to identify temporal and spatial relationships.
- examine the strengths and limitations of representations such as physical models, diagrams and virtual simulations and select the most appropriate representation to use.
- examine competing ideas, differences in methods and sources of error when constructing an argument.
Whole class
Tectonic collision course Resource PowerPoint
Liquefaction model
Medium plastic tub
Clean beach/playground sand (enough to ¾ fill the tub)
Water (enough to make all the sand damp without pooling at the top surface)
Large spoon
Ping pong ball
Heavier objects (toy metal car, solid house or a filled jar of water)
Plastic toy animal
Seismic wave model
Large plastic tub
4 occy straps (to fit snuggly across the width of the plastic tub)
Flexible surface to place on top of occy straps e.g. artificial grass mat
Objects to place on the flexible surface (toy car, house or person)
Optional: a vibrometer app or micro:bit that shows movement in three dimensions
Locating the epicentre
Three pages of the Epicentre Hunt - student activity from Geoscience Australia:
- Seismograms from Quakeville Station, Pearsons Crossing Station and Well Station (page 5)
- Time-distance graph (page 2)
- Quakeville area seismic stations (page 4)
Ruler
Pencil
Compass drawing tool
Each group
Large long spring (Slinky or similar)
Each student
Individual science notebook
Modelling earthquakes Resource sheet
Lesson
Re-orient
Recall the previous lesson focusing on revising the different types of tectonic boundaries and how they move.
The Inquire phase allows students to cycle progressively and with increasing complexity through the key science ideas related to the core concepts. Each Inquire cycle is divided into three teaching and learning routines that allow students to systematically build their knowledge and skills in science and incorporate this into their current understanding of the world.
When designing a teaching sequence, it is important to consider the knowledge and skills that students will need in the final Act phase. Consider what the students already know and identify the steps that need to be taken to reach the level required. How could you facilitate students’ understanding at each step? What investigations could be designed to build the skills at each step?
Read more about using the LIA FrameworkIdentifying and constructing questions is the creative driver of the inquiry process. It allows students to explore what they know and how they know it. During the Inquire phase of the LIA Framework, the Question routine allows for past activities to be reviewed and to set the scene for the investigation that students will undertake. The use of effective questioning techniques can influence students’ view and interpretation of upcoming content, open them to exploration and link to their current interests and science capital.
When designing a teaching sequence, it is important to spend some time considering the mindset of students at the start of each Inquire phase. What do you want students to be thinking about, what do they already know and what is the best way for them to approach the task? What might tap into their curiosity?
Read more about using the LIA FrameworkImpact of earthquakes
Discuss the different ways the Earth can move at a boundary: up and down, side to side, or a combination of both.
Compare how the Earth would move on each side of a slipping subducting boundary—one side of the boundary might lift, sink, move sideways, or be compressed.
(Slide 45) Pose the question: How could we predict the effect that earthquakes will have?
The Inquire phase allows students to cycle progressively and with increasing complexity through the key science ideas related to the core concepts. Each Inquire cycle is divided into three teaching and learning routines that allow students to systematically build their knowledge and skills in science and incorporate this into their current understanding of the world.
When designing a teaching sequence, it is important to consider the knowledge and skills that students will need in the final Act phase. Consider what the students already know and identify the steps that need to be taken to reach the level required. How could you facilitate students’ understanding at each step? What investigations could be designed to build the skills at each step?
Read more about using the LIA FrameworkThe Investigate routine provides students with an opportunity to explore the key ideas of science, to plan and conduct an investigation, and to gather and record data. The investigations are designed to systematically develop content knowledge and skills through increasingly complex processes of structured inquiry, guided inquiry and open inquiry approaches. Students are encouraged to process data to identify trends and patterns and link them to the real-world context of the teaching sequence.
When designing a teaching sequence, consider the diagnostic assessment (Launch phase) that identified the alternative conceptions that students held. Are there activities that challenge these ideas and provide openings for discussion? What content knowledge and skills do students need to be able to complete the final (Act phase) task? How could you systematically build these through the investigation routines? Are there opportunities to build students’ understanding and skills in the science inquiry processes through the successive investigations?
Read more about using the LIA FrameworkModelling waves
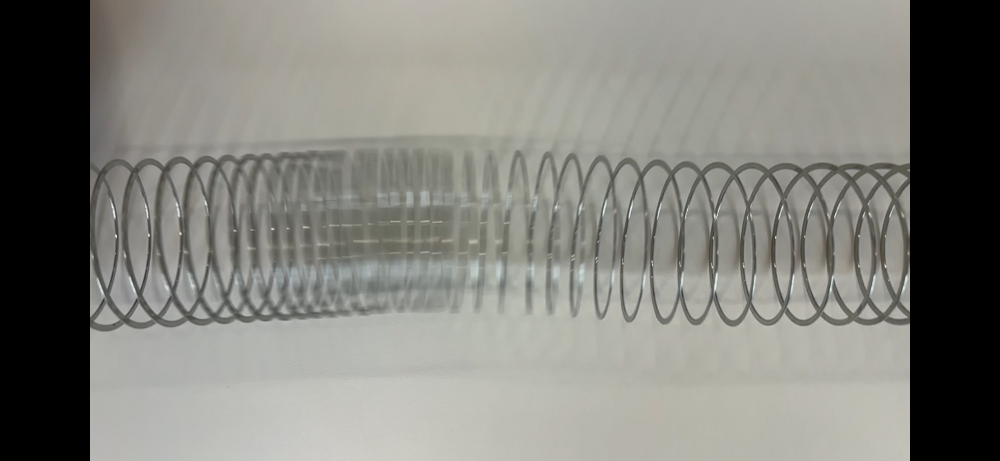
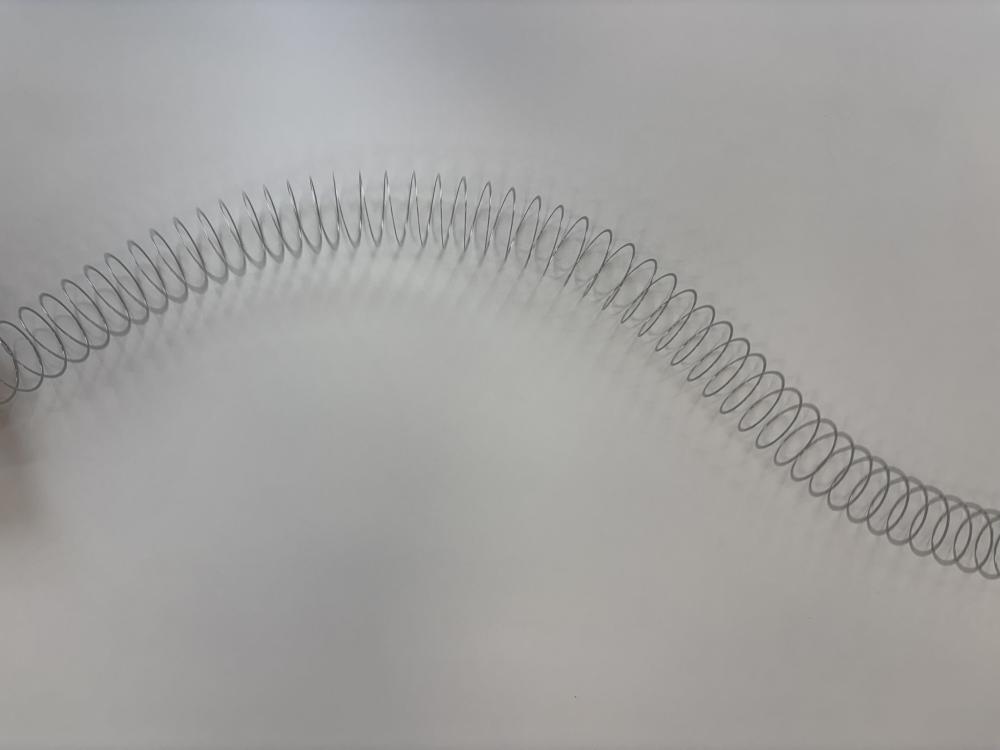
Provide student teams with a large spring (or demonstrate as a class). Invite two students to stretch the large spring out to model the movement of the Earth.
Discuss how the spring could be used to model the Earth being quickly compressed or decompressed. If required, demonstrate each type of wave for the students.
(Slide 46) Explain how the first type of earthquake wave to arrive is the P or primary wave. This is when the earth compresses or is released from compression. These waves travel through all layers of the Earth, including the flexible molten mantle.
(Slide 47) Explain that the S or secondary shear wave is next to arrive. This occurs when the Earth moves side to side, perpendicular to the direction of the wave/energy. These waves travel through the solid layers of the Earth.
(Slide 48 and 49) Discuss how surface waves are the last to arrive. These waves only travel along the Earth’s surface and can have a rolling action.
- How do P waves move the ground, and how might this motion feel to a person?
- How do S waves move differently from P waves?
- Why are surface waves usually responsible for the most damage?
- How might the motion caused by S waves or surface waves affect a person’s balance?
- Why do some people describe earthquakes as rolling, shaking, or jolting?
- How might people experience different motions depending on how close they are to the epicentre?
- Why is understanding seismic wave motion important for earthquake-resistant building design?
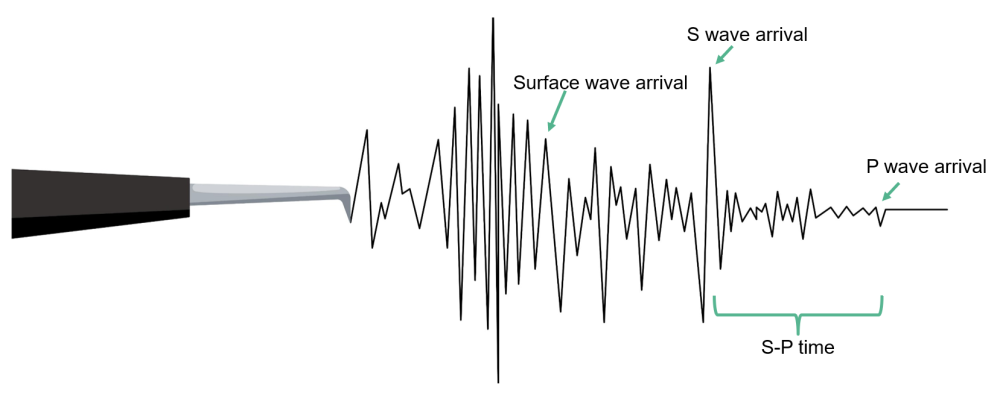
(Slide 50) Provide an example of the earthquake waves shown on a seismogram. Identify the different waves (P waves, S waves and surface waves) on the diagram.
Discuss how the different types of waves provide different motions for people and buildings on the Earth’s crust.
Earthquake waves
There are three main types of seismic waves: P waves, S waves, and surface waves.
Earthquakes release energy that spreads outward in all directions as waves called seismic waves. There are three main types of seismic waves.
P (primary or compressional) waves
P waves cause rocks to move back and forth (compress) in the same direction that the wave is travelling. For this reason, they are also called ‘longitudinal’ or ‘pressure’ waves. P waves can travel through both the solid and liquid layers of the Earth, allowing them to pass through the Earth’s crust, mantle, and core. Near the Earth’s surface, P waves travel at about 6 km/s in hard rock, while they travel at >13 km/s in the lower mantle. P waves are the fastest seismic waves and can travel to the opposite side of the Earth (12,715 km to 12,756 km) in less than 20 minutes.
S (secondary or shear) waves
S waves move rocks either up and down, or side to side, at right angles (90 degrees) to the direction of wave travel. S waves can only travel through solid materials. As a result, they do not pass through the Earth’s outer core, which is made of liquid iron and nickel. Near the Earth’s surface, S waves travel at about 3 km/s in hard rock.
Surface waves
Surface waves are the slowest waves that are generated by earthquakes. They are the last to arrive and travel like the ripples of a wave. They are the most destructive waves as they include horizontal shaking (Love waves) and rolling vertical motion (Rayleigh waves).
P waves and S waves travel through the Earth’s interior, while surface waves move along the Earth’s surface.
The difference in speed means that the P wave will arrive before the S wave. The difference between the arrival times is called the ‘S-P time’. If the earthquake occurred close to a sensor, the S-P time will be short.
If the earthquake occurred a great distance away from a sensor, the S-P time will be much longer (increasing by 1 second for every 8.4 km from the epicentre).
The Inquire phase allows students to cycle progressively and with increasing complexity through the key science ideas related to the core concepts. Each Inquire cycle is divided into three teaching and learning routines that allow students to systematically build their knowledge and skills in science and incorporate this into their current understanding of the world.
When designing a teaching sequence, it is important to consider the knowledge and skills that students will need in the final Act phase. Consider what the students already know and identify the steps that need to be taken to reach the level required. How could you facilitate students’ understanding at each step? What investigations could be designed to build the skills at each step?
Read more about using the LIA FrameworkFollowing an investigation, the Integrate routine provides time and space for data to be evaluated and insights to be synthesized. It reveals new insights, consolidates and refines representations, generalises context and broadens students’ perspectives. It allows student thinking to become visible and opens formative feedback opportunities. It may also lead to further questions being asked, allowing the Inquire phase to start again.
When designing a teaching sequence, consider the diagnostic assessment that was undertaken during the Launch phase. Consider if alternative conceptions could be used as a jumping off point to discussions. How could students represent their learning in a way that would support formative feedback opportunities? Could small summative assessment occur at different stages in the teaching sequence?
Read more about using the LIA FrameworkComparing waves
(Slide 51) Make a direct comparison between the different types of waves that make up an earthquake.
✎ STUDENT NOTES: Compare the difference between P and S and surface waves.
| P waves | S waves | Surface waves |
| The first wave measured by seismograph | The second wave measured by seismograph | The last waves measured by seismograph |
| Compression wave | Transverse/shear waves | Highest amplitude waves |
| Move through solids and liquids | Only move through solids (not liquids) | Travel across the surface of the Earth |
| Medium moves in the same direction as the wave/energy movement | Medium moves in a perpendicular direction to the wave/energy movement | Medium moves side to side or in a rolling motion |
(Slide 52) Pose the question: How can we model the different types of earthquake waves and their impact?
The Inquire phase allows students to cycle progressively and with increasing complexity through the key science ideas related to the core concepts. Each Inquire cycle is divided into three teaching and learning routines that allow students to systematically build their knowledge and skills in science and incorporate this into their current understanding of the world.
When designing a teaching sequence, it is important to consider the knowledge and skills that students will need in the final Act phase. Consider what the students already know and identify the steps that need to be taken to reach the level required. How could you facilitate students’ understanding at each step? What investigations could be designed to build the skills at each step?
Read more about using the LIA FrameworkThe Investigate routine provides students with an opportunity to explore the key ideas of science, to plan and conduct an investigation, and to gather and record data. The investigations are designed to systematically develop content knowledge and skills through increasingly complex processes of structured inquiry, guided inquiry and open inquiry approaches. Students are encouraged to process data to identify trends and patterns and link them to the real-world context of the teaching sequence.
When designing a teaching sequence, consider the diagnostic assessment (Launch phase) that identified the alternative conceptions that students held. Are there activities that challenge these ideas and provide openings for discussion? What content knowledge and skills do students need to be able to complete the final (Act phase) task? How could you systematically build these through the investigation routines? Are there opportunities to build students’ understanding and skills in the science inquiry processes through the successive investigations?
Read more about using the LIA FrameworkModelling earthquakes
(Slides 53-55) Introduce the three models of earthquakes, either sequentially or simultaneously set up around the classroom.
Provide students with the Modelling earthquakes Resource sheet and the relevant pages of the Epicentre Hunt – student activity by Geoscience Australia. Allow students to explore each model, identifying its purpose and limitations.
- Place the large tub (with no lid) on a flat surface.
- Hook the occy straps on the short edges of the large tub so that they are suspended across the open top.
- Place the flexible surface on top of the suspended occy straps to represent the Earth’s crust.
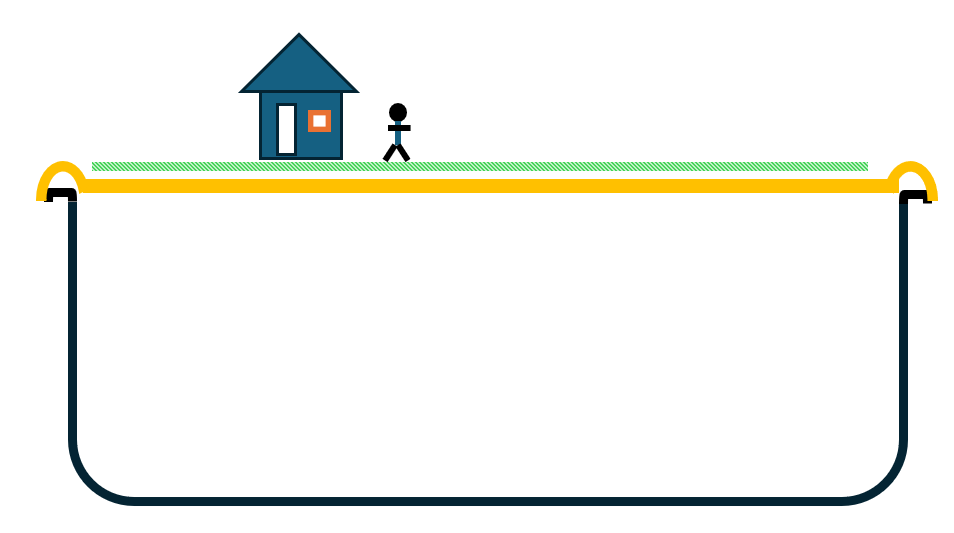
- Pull or push the occy straps to model:
- P waves: pull then release the occy straps
- S waves: move the occy straps from side to side
- Surface waves: move the occy straps down and then quickly release them
- Place the sand and water in the plastic tub.
- Mix it thoroughly until all the sand is consistently damp.
- Use the spoon to bury the ping pong ball in the sand. This represents an empty tank or pipe that is buried under the ground.
- Place the remaining objects on the surface of the sand.
- Simulate an earthquake by tapping the side of the tub or gently shaking the tub back and forth.
- Identify the P and S waves on the seismograms from Quakeville Station, Pearsons Crossing Station and Well Station.
- Measure the time between the start of the P and S waves on each graph (P-S time). This can be done by using the time measurements at the base of each graph (10 marks = 1 seconds). Record this time in Table 1 of the Resource sheet.
- Use the time-distance graph on page 2 of Epicentre hunt to convert the measured P-S time for each station into a distance. Record this distance in Table 1.
- Identify the town of Quakeville on the map on page 4 of Epicentre hunt.
- Expand the compass drawing tool to 5.3 cm between the pencil and the metal point. This represents 53 km (the distance between the town and the epicentre).
- Place the metal point of the compass drawing tool in the centre of Quakeville. Draw a circle around the town to represent the possible locations of the epicentre.
- Repeat this process of expanding the compass to the appropriate distance for Pearson Crossing Station and Well Station and drawing a circle around each station.
- Mark an ‘X’ on the location where all three lines overlap to show the epicentre of the earthquake.
✎ STUDENT NOTES: Complete the questions related to each activity.
Liquefaction
Liquefaction occurs during an earthquake when loose, sandy soil that is saturated with water is shaken.
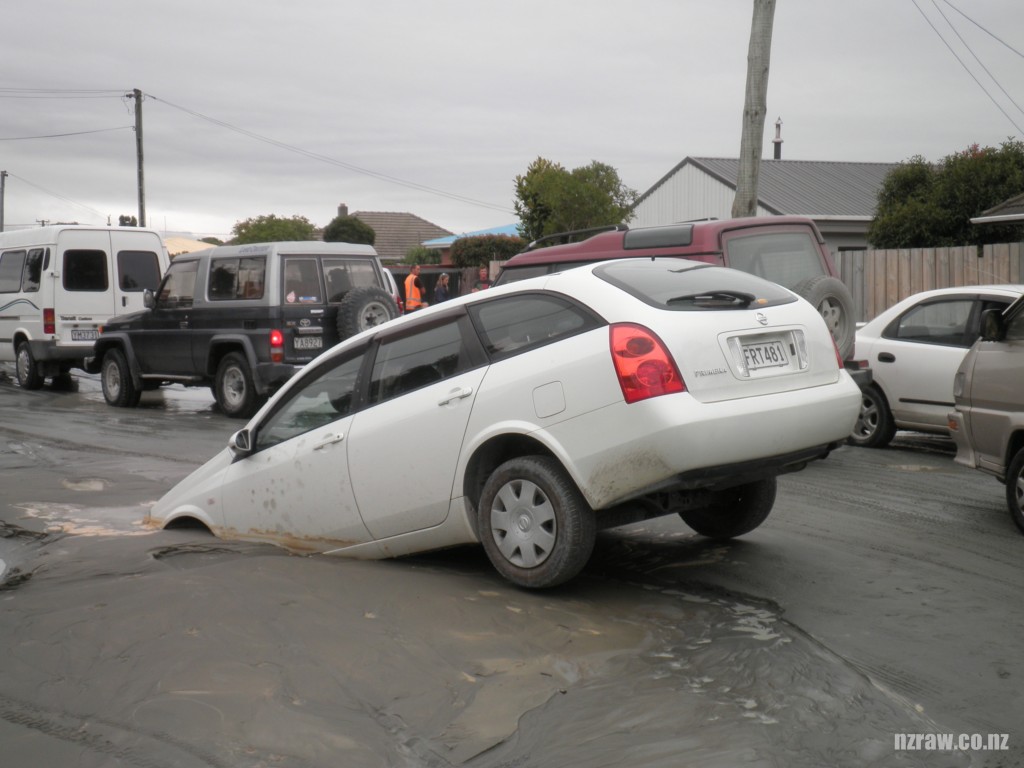
Liquefaction occurs during an earthquake when loose, sandy soil saturated with water is shaken. Normally, soil particles touch each other and can support weight. However, when strong shaking happens, the soil particles are forced apart, and the water pressure between them increases. As a result, the soil loses its strength and begins to behave like a liquid.
When liquefaction happens, the ground can no longer support heavy objects like buildings, roads, or other structures. This can cause buildings to sink, tilt, or collapse, even if they are not badly damaged by the shaking itself. Lighter objects like underground pipes may become buoyant and rise to the surface, and cracks can form in the ground.
Liquefaction is most likely to occur in areas with:
- loose or sandy soil.
- high groundwater levels (or recent heavy rainfall saturating the soil, e.g. the 2011 New Zealand earthquake).
- strong and prolonged earthquake shaking (over magnitude 6).
It is important to emphasise that liquefaction does not happen everywhere during an earthquake. Solid rock or dry compact soil does not liquefy. This helps explain why some areas experience much more damage than others during the same earthquake.
Liquefaction models are useful for helping students visualise this process, but they simplify real conditions. In real life, soil layers, depth and pressure vary greatly, which affects how liquefaction occurs.
The Inquire phase allows students to cycle progressively and with increasing complexity through the key science ideas related to the core concepts. Each Inquire cycle is divided into three teaching and learning routines that allow students to systematically build their knowledge and skills in science and incorporate this into their current understanding of the world.
When designing a teaching sequence, it is important to consider the knowledge and skills that students will need in the final Act phase. Consider what the students already know and identify the steps that need to be taken to reach the level required. How could you facilitate students’ understanding at each step? What investigations could be designed to build the skills at each step?
Read more about using the LIA FrameworkFollowing an investigation, the Integrate routine provides time and space for data to be evaluated and insights to be synthesized. It reveals new insights, consolidates and refines representations, generalises context and broadens students’ perspectives. It allows student thinking to become visible and opens formative feedback opportunities. It may also lead to further questions being asked, allowing the Inquire phase to start again.
When designing a teaching sequence, consider the diagnostic assessment that was undertaken during the Launch phase. Consider if alternative conceptions could be used as a jumping off point to discussions. How could students represent their learning in a way that would support formative feedback opportunities? Could small summative assessment occur at different stages in the teaching sequence?
Read more about using the LIA FrameworkComparing models
(Slide 56) Discuss the advantages and limitations of each model.
| Model | Advantages | Limitation |
| Seismic wave model | Explains wave movement and energy Improves our understanding of Earth’s internal structure (mantle/core) | Limited information on surface impact |
| Liquefaction model | Explains ground failure and building collapse Useful for urban planning | Only applies in certain soil environments Needs detailed local soil and groundwater data |
| Epicentre model | Identifies the location of the epicentre for emergency response Identifies high-risk areas | Requires multiple seismograph locations Does not identify the magnitude of the earthquake |
✎ STUDENT NOTES: Record the advantages and limitations of each model.
(Slide 57) Use the Earthquakes@GA website to find seismograms of the latest earthquakes. Select an earthquake dot on the map, then select the ‘+’ next to “Seismograms’ on the pop-up menu to view the seismogram recordings from each nearby station.
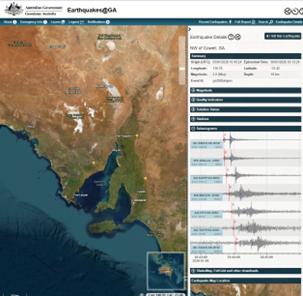
Discuss how geoscientists at Geoscience Australia are constantly monitoring all earthquakes across Australia.
- How does Geoscience Australia detect earthquakes across such a large and sparsely populated country?
- How might satellite data and digital communication improve earthquake monitoring in remote areas?
- In what ways can this information be used to improve building codes and infrastructure safety?
- How does Geoscience Australia share earthquake information with emergency services and the public?
- Why is it important for earthquake information to be released quickly and accurately?
- How might climate, terrain, or human activity interfere with earthquake monitoring?
Optional: Watch the video Why are earthquakes so hard to predict? (4:52).
Reflect on the lesson
You might invite students to:
- add the following words to a glossary: epicentre, P wave, S wave, surface wave.
- watch the video Nuclear bomb test or earthquake? How we tell the difference (stop watching at 5:52 to avoid a sponsored advertisement).
- re-examine the intended learning goals for the lesson and consider how they were achieved.
Geoscience Australia’s National Earthquake Alert Centre
Scientists working at NEAC apply principles of seismology, physics and data analysis to monitor earthquakes continuously, 24 hours a day.
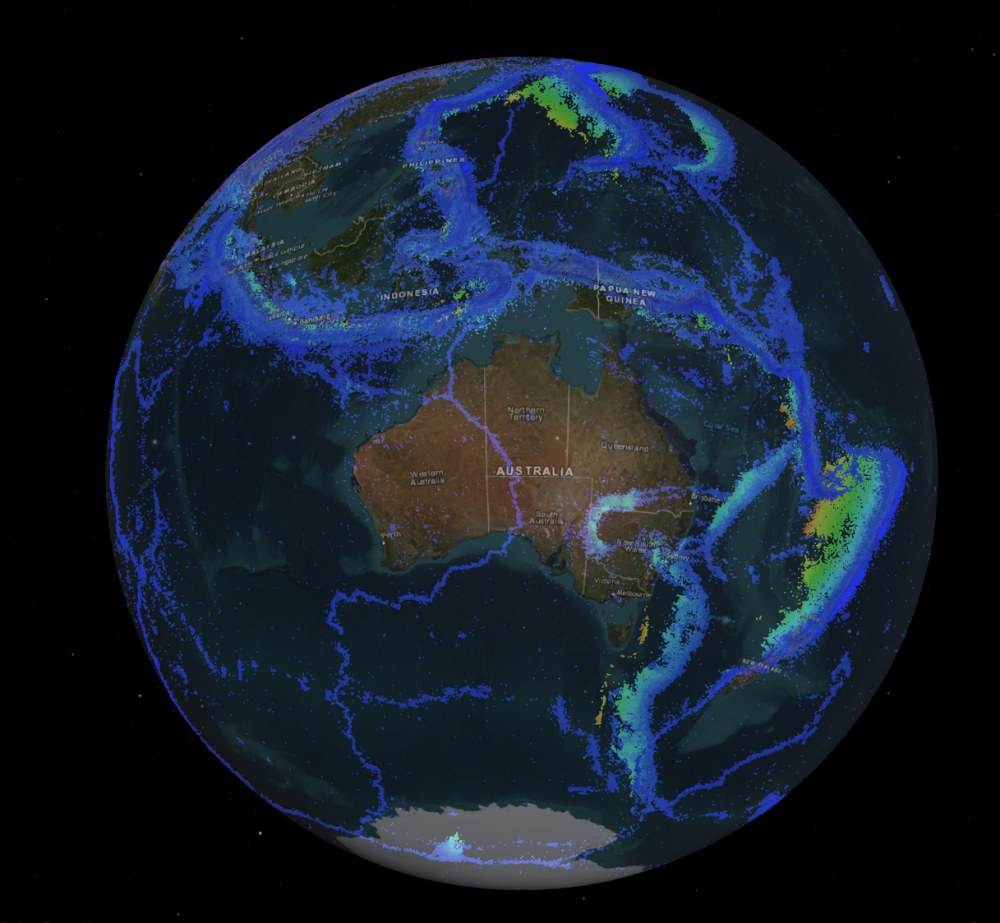
The National Earthquake Alerts Centre (NEAC), operated by Geoscience Australia, provides a real-world example of how earth science careers connect research, technology and public safety. Scientists working at NEAC apply principles of seismology, physics and data analysis to monitor earthquakes continuously, 24 hours a day. Their role is not only to detect earthquakes, but also to interpret complex seismic data quickly and accurately so that emergency managers and governments can respond effectively.
NEAC scientists use advanced computing systems and real-time data from hundreds of seismic stations in Australia and around the world. They calculate an earthquake’s location, depth and magnitude, model ground shaking through tools such as ShakeMap, and analyse public shaking reports to create intensity maps known as FeltGrids. This work demonstrates how scientific knowledge, mathematics and technology are combined in practical settings to solve time-critical problems. NEAC also collaborates with the Joint Australian Tsunami Warning Centre to assess whether undersea earthquakes may generate tsunamis.
The centre follows a structured three-stage review process (Initial, Interim, and Final Reviews) to refine earthquake information as more data becomes available. Confirmed events are added to Australia’s Earthquake Catalogue, which supports long-term hazard research and disaster planning.