Tectonic collision course
View Sequence overviewStudents will:
- examine the forces that act on tectonic plates including convection, slab pull and ocean ridge push.
- use data to graphically model a subduction boundary.
- identify different boundaries using the 3D map in the Geoscience Australia Portal.
- compare graphical and 3D models of tectonic plate boundaries.
Students will represent their understanding as they:
- draw their observations of a model of convection on a crust.
- use the TRAAP method to identify the appropriateness of geoscience data.
- graph the longitude vs depth of historic earthquakes at a subduction boundary.
- compare the advantages and disadvantages of different representations (graphs vs 3D).
- explain what the subduction boundary graph represents.
In this lesson, assessment is formative.
Feedback might focus on students’ ability to:
- use data to generate a mathematical model of a tectonic boundary.
- describe a subduction boundary, a convergent boundary, a divergent boundary, and a transforming boundary.
- identify the forces involved in tectonic plate movement, including slab pull, ridge push, and convection.
Potential summative task
Students working at the achievement standard should:
- model interactions at plate boundaries.
- investigate the relative significance of different forces involved in tectonic plate movement, including slab pull, ridge push and convection.
- use visual displays of large data sets to identify temporal and spatial relationships.
- constructing graphs using correct conventions, such as naming the graph and labelling the axes.
- evaluate the quality of evidence of primary and secondary sources used when constructing an argument to support a conclusion or claim.
- examine the strengths and limitations of representations such as physical models, diagrams, and virtual simulations, and selecting the most appropriate
Whole class
Tectonic collision course Resource PowerPoint
Hotplate
Saucepan
Milk
Milo powder (Milo produces a thick layer on the surface of the milk, better than other powdered products)
Spoon
Video: The science behind earthquakes explained (5:20)
Access to the Geoscience Australia Portal 3D map
Each student
Individual science notebook
Access to spreadsheet software (e.g. Microsoft Excel)
Access to the Geoscience Australia Portal 3D map
Indo-Australian earthquake Data resource
Lesson
The Inquire phase allows students to cycle progressively and with increasing complexity through the key science ideas related to the core concepts. Each Inquire cycle is divided into three teaching and learning routines that allow students to systematically build their knowledge and skills in science and incorporate this into their current understanding of the world.
When designing a teaching sequence, it is important to consider the knowledge and skills that students will need in the final Act phase. Consider what the students already know and identify the steps that need to be taken to reach the level required. How could you facilitate students’ understanding at each step? What investigations could be designed to build the skills at each step?
Read more about using the LIA FrameworkRe-orient
Recall the previous lesson focusing on how the tectonic plates have moved over time.
Discuss how Australia used to be joined to Antarctica, and was part of the larger land mass Gondwana (containing South America, Africa, Madagascar, India, Antarctica, and Australia).
The Inquire phase allows students to cycle progressively and with increasing complexity through the key science ideas related to the core concepts. Each Inquire cycle is divided into three teaching and learning routines that allow students to systematically build their knowledge and skills in science and incorporate this into their current understanding of the world.
When designing a teaching sequence, it is important to consider the knowledge and skills that students will need in the final Act phase. Consider what the students already know and identify the steps that need to be taken to reach the level required. How could you facilitate students’ understanding at each step? What investigations could be designed to build the skills at each step?
Read more about using the LIA FrameworkIdentifying and constructing questions is the creative driver of the inquiry process. It allows students to explore what they know and how they know it. During the Inquire phase of the LIA Framework, the Question routine allows for past activities to be reviewed and to set the scene for the investigation that students will undertake. The use of effective questioning techniques can influence students’ view and interpretation of upcoming content, open them to exploration and link to their current interests and science capital.
When designing a teaching sequence, it is important to spend some time considering the mindset of students at the start of each Inquire phase. What do you want students to be thinking about, what do they already know and what is the best way for them to approach the task? What might tap into their curiosity?
Read more about using the LIA FrameworkMoving mountains
Discuss how the tectonic plates sit on top of the solid, but flowing, mantle/asthenosphere.
Pose the question: Why do the tectonic plates move?
The Inquire phase allows students to cycle progressively and with increasing complexity through the key science ideas related to the core concepts. Each Inquire cycle is divided into three teaching and learning routines that allow students to systematically build their knowledge and skills in science and incorporate this into their current understanding of the world.
When designing a teaching sequence, it is important to consider the knowledge and skills that students will need in the final Act phase. Consider what the students already know and identify the steps that need to be taken to reach the level required. How could you facilitate students’ understanding at each step? What investigations could be designed to build the skills at each step?
Read more about using the LIA FrameworkThe Investigate routine provides students with an opportunity to explore the key ideas of science, to plan and conduct an investigation, and to gather and record data. The investigations are designed to systematically develop content knowledge and skills through increasingly complex processes of structured inquiry, guided inquiry and open inquiry approaches. Students are encouraged to process data to identify trends and patterns and link them to the real-world context of the teaching sequence.
When designing a teaching sequence, consider the diagnostic assessment (Launch phase) that identified the alternative conceptions that students held. Are there activities that challenge these ideas and provide openings for discussion? What content knowledge and skills do students need to be able to complete the final (Act phase) task? How could you systematically build these through the investigation routines? Are there opportunities to build students’ understanding and skills in the science inquiry processes through the successive investigations?
Read more about using the LIA FrameworkDemonstrating convection
(Slide 23) As a class demonstration, model the convection of the Earth’s layers by following the below steps.
- Add milk to the saucepan so that it is half to three-quarters full. Discuss how this represents the flowing mantle. Note the limitation of this model: the mantle is actually a solid that can flow, not a liquid like milk.
- Place the saucepan on the hotplate.
- Carefully spoon Milo onto the surface of the milk to create a thick layer (at least 1 cm thick). Discuss how this represents the lithosphere layer, similar to the tectonic plates.
- Turn on the hotplate so that the milk will eventually simmer (not boil).
- Observe what happens to the Milo layer as the milk heats up.
The Milo layer will start to crack into ‘tectonic plates’. Careful observation will allow students to identify Milo plates moving apart (diverging), crashing into one another (converging), moving under one another (subducting), moving alongside each other (transforming), and even hot-spots (volcanic islands).
Draw students’ attention to isolated ‘volcano’ hot-spots where the hot milk is bubbling up through thin layers of the surface Milo. Compare this to the volcanoes that built the islands in Hawaii and the Galapagos Islands.
Core heat
The Earth’s interior heat comes from two main sources.
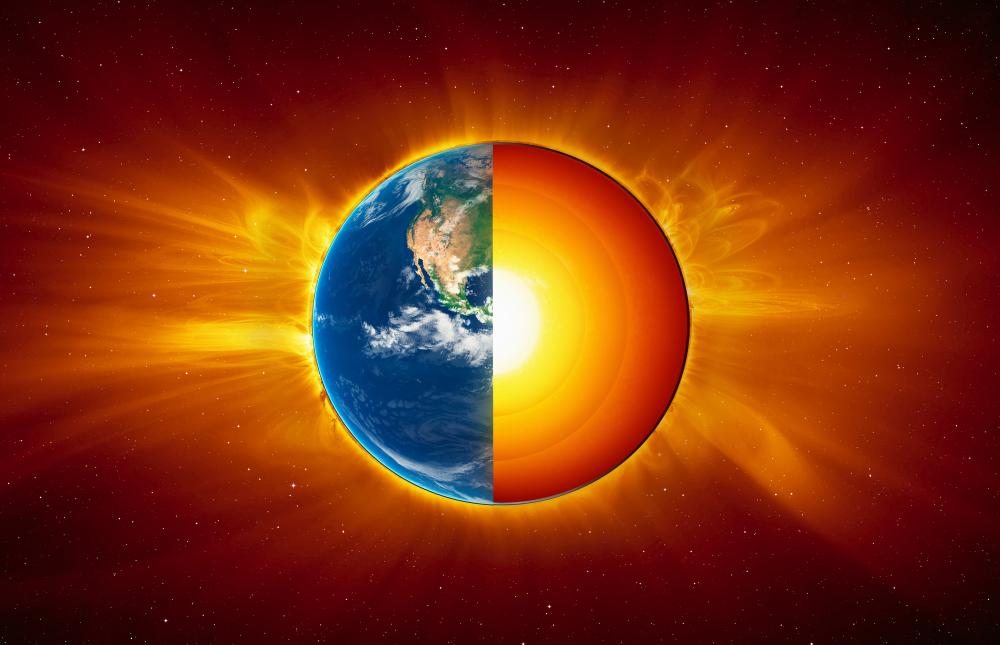
The Earth’s interior heat comes from two main sources:
1. Primordial heat: leftover energy from the planet forming and accumulating material.
2. Radioactive decay: heat from elements like potassium, uranium, and thorium (the exact amounts are uncertain).
Heat moves out from the centre of the Earth slowly. Some heat rises through convection, which is the movement of hot, less dense material upward, like boiling water, and cooler, denser material downward. The crust acts like a thermal blanket, slowing cooling. Most heat escapes at plate boundaries, especially mid-ocean ridges. Smaller planets, like Mars or the Moon, show little tectonic activity because they have lost most of their internal heat.
The Inquire phase allows students to cycle progressively and with increasing complexity through the key science ideas related to the core concepts. Each Inquire cycle is divided into three teaching and learning routines that allow students to systematically build their knowledge and skills in science and incorporate this into their current understanding of the world.
When designing a teaching sequence, it is important to consider the knowledge and skills that students will need in the final Act phase. Consider what the students already know and identify the steps that need to be taken to reach the level required. How could you facilitate students’ understanding at each step? What investigations could be designed to build the skills at each step?
Read more about using the LIA FrameworkFollowing an investigation, the Integrate routine provides time and space for data to be evaluated and insights to be synthesized. It reveals new insights, consolidates and refines representations, generalises context and broadens students’ perspectives. It allows student thinking to become visible and opens formative feedback opportunities. It may also lead to further questions being asked, allowing the Inquire phase to start again.
When designing a teaching sequence, consider the diagnostic assessment that was undertaken during the Launch phase. Consider if alternative conceptions could be used as a jumping off point to discussions. How could students represent their learning in a way that would support formative feedback opportunities? Could small summative assessment occur at different stages in the teaching sequence?
Read more about using the LIA FrameworkTectonic boundaries
(Slide 23 animation) Discuss how the milk is heated at the base of the saucepan by the hotplate, similar to the more liquid mantle in the centre of the Earth. Heated milk particles have more energy and are less dense. This makes them come to the top (convection) and cause cracks in the Milo.
(Slide 24) ✎ STUDENT NOTES: Draw a picture of the convection of heated milk with arrows showing the direction of energy flow. Define convection as the transfer of heat through the physical movement of a fluid caused by density differences. This means hotter, less dense material rises, while cooler, more dense material sinks.
(Slide 25) Discuss the four features of tectonic plate movement: convergence, divergence, subduction, and hot-spots. See the embedded professional learning Tectonic plate features below for more information.
- How does the heat in the centre of the Earth affect the surface of the Earth?
- What can happen when two tectonic plates move toward each other?
- How can convergent boundaries cause mountains or earthquakes?
- What happens when plates move away from each other?
- Where on Earth are divergent boundaries commonly found?
- What is subduction, and how is it different from general convergence?
- Why does one plate sink under another at a subduction zone?
- What natural events (volcanoes, earthquakes, trenches) are common near subduction zones?
- What is a hot-spot, and how is it different from a plate boundary?
- How are convergence and divergence opposites?
- Which of the four features do you think causes the most dramatic changes to Earth’s surface? Why?
- How does tectonic plate movement help explain earthquakes and volcanoes around the world?
- Why is it important for people living near plate boundaries or hot-spots to understand these processes?
✎ STUDENT NOTES: (Slides 26-27) Define the different types of boundaries found at the edges of tectonic plates. Draw a picture to illustrate each boundary.
Pose the question: Do tectonic plates move as fast as our Milo model?
Discuss how tectonic plates move only millimetres or centimetres each year in the real world. Australia moves 7 cm towards Indonesia each year. Calculate how far this movement has been so far in a student’s lifetime (14 x 7 cm = 98 cm). Compare this to First Nations Peoples, who have seen Australia move 4.5 km in the 65,000 years they have inhabited this land.
Tectonic plate features
There are three main types of tectonic plate boundaries, which are defined by how neighbouring tectonic plates move against each other.
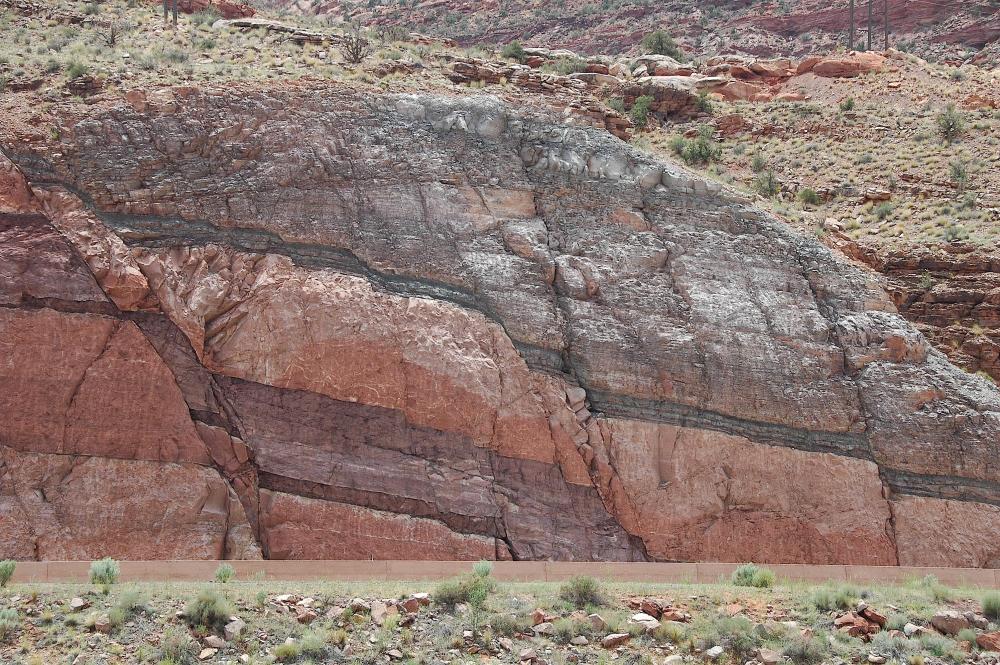
Earthquakes are associated with faults, which are fractures in the Earth’s crust where rocks move past each other. Faults are classified according to the direction of movement of the rocks on either side of the fault plane (the surface along which movement occurs during an earthquake).
There are three main types of plate boundaries:
- Divergent boundaries occur where plates move away from each other. As they separate, magma rises from the mantle and creates new crust. These areas are commonly associated with normal faults, where the crust is pulled apart.
- Convergent boundaries occur when plates move toward each other. Sometimes one plate may be forced beneath another in a process called subduction, which destroys crust. This can distort the tectonic plates on either side of the boundary.
- Transform boundaries occur when plates slide horizontally past one another. The crust is neither created nor destroyed at these boundaries. They are typically associated with strike-slip faults, where rocks move sideways past each other.
Not all earthquakes and volcanic activity occur at plate boundaries. Some occur in the middle of tectonic plates at locations known as hot-spots. Hot-spots form above relatively stationary columns of hot mantle material called mantle plumes, which rise toward the surface and melt through the crust. As a tectonic plate moves over a hot-spot, a chain of volcanoes may form over time. The Hawaiian Islands are a well-known example of a hot-spot volcanic chain.
Hot-spots can also generate earthquakes, although these are usually less frequent than those occurring along plate boundaries.
The Inquire phase allows students to cycle progressively and with increasing complexity through the key science ideas related to the core concepts. Each Inquire cycle is divided into three teaching and learning routines that allow students to systematically build their knowledge and skills in science and incorporate this into their current understanding of the world.
When designing a teaching sequence, it is important to consider the knowledge and skills that students will need in the final Act phase. Consider what the students already know and identify the steps that need to be taken to reach the level required. How could you facilitate students’ understanding at each step? What investigations could be designed to build the skills at each step?
Read more about using the LIA FrameworkIdentifying and constructing questions is the creative driver of the inquiry process. It allows students to explore what they know and how they know it. During the Inquire phase of the LIA Framework, the Question routine allows for past activities to be reviewed and to set the scene for the investigation that students will undertake. The use of effective questioning techniques can influence students’ view and interpretation of upcoming content, open them to exploration and link to their current interests and science capital.
When designing a teaching sequence, it is important to spend some time considering the mindset of students at the start of each Inquire phase. What do you want students to be thinking about, what do they already know and what is the best way for them to approach the task? What might tap into their curiosity?
Read more about using the LIA FrameworkAustralian boundaries
Show the video The science behind earthquakes explained (5:20).
✎ STUDENT NOTES: Describe how earthquakes are measured using the moment magnitude scale.
Discuss how Australia is at the centre of the Indo-Australian plate.
- What does it mean for Australia to be near the centre of a tectonic plate?
- How does being in the middle of a plate affect how often Australia experiences earthquakes or volcanoes?
- Is the Indo-Australian Plate still moving even though Australia is not near a boundary?
- How might life be different in a country located on a plate boundary compared to Australia?
Pose the question: How can we tell what type of boundary is at the edges of the Indo-Australian plate?
The Inquire phase allows students to cycle progressively and with increasing complexity through the key science ideas related to the core concepts. Each Inquire cycle is divided into three teaching and learning routines that allow students to systematically build their knowledge and skills in science and incorporate this into their current understanding of the world.
When designing a teaching sequence, it is important to consider the knowledge and skills that students will need in the final Act phase. Consider what the students already know and identify the steps that need to be taken to reach the level required. How could you facilitate students’ understanding at each step? What investigations could be designed to build the skills at each step?
Read more about using the LIA FrameworkThe Investigate routine provides students with an opportunity to explore the key ideas of science, to plan and conduct an investigation, and to gather and record data. The investigations are designed to systematically develop content knowledge and skills through increasingly complex processes of structured inquiry, guided inquiry and open inquiry approaches. Students are encouraged to process data to identify trends and patterns and link them to the real-world context of the teaching sequence.
When designing a teaching sequence, consider the diagnostic assessment (Launch phase) that identified the alternative conceptions that students held. Are there activities that challenge these ideas and provide openings for discussion? What content knowledge and skills do students need to be able to complete the final (Act phase) task? How could you systematically build these through the investigation routines? Are there opportunities to build students’ understanding and skills in the science inquiry processes through the successive investigations?
Read more about using the LIA FrameworkUsing data
Explain that scientists can use data about the depth of earthquakes to provide a picture of a boundary.
Provide students with the Indo-Australian earthquake Data resource, which contains earthquake data from the boundary north of New Zealand. Explain this data came from the Geoscience Australia Portal, and, as a class, use the TRAAP method to evaluate its usefulness as a source.
Divide groups of students according to their abilities and select the appropriate data tabs from the Indo-Australian earthquake Data resource.
There are four sets of data provided as part of this activity.
- Group A: Five years of earthquake data including location, latitude, longitude, magnitude, depth, date/time, and data source.
- Group B: Five years of earthquake data that includes only location, longitude and depth.
- Group C: 21 data points (location, longitude and depth) that provide a simplified image when graphed
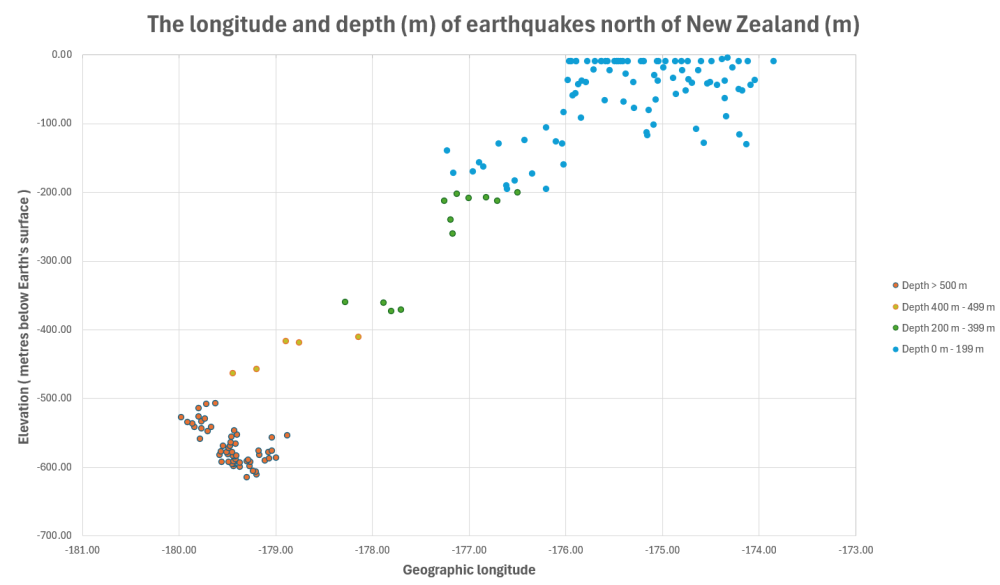
- Group D: 21 data points (location, longitude and depth) with a pre-drawn graph showing the longitude and depth (m) of earthquakes north of New Zealand.
The tab Colourised graph contains five years of earthquake data graphed with colourised data points to reflect the depth of the earthquakes. This can be used to demonstrate the colours used in the Geoscience Australia 3D images.
Discuss how the depth of each earthquake is measured by elevation above sea level. A negative elevation suggests that the earthquakes are occurring below the Earth’s surface. The larger the negative number, the deeper under the Earth.
(Slide 29) Guide the students through the process of creating a chart:
- Select/highlight the ‘Longitude’ and ‘Elevation’ columns in the table.
- Select ‘Insert’ and then ‘Scatter graph’ in the ‘Charts’ section of the top ribbon of the Excel spreadsheet.
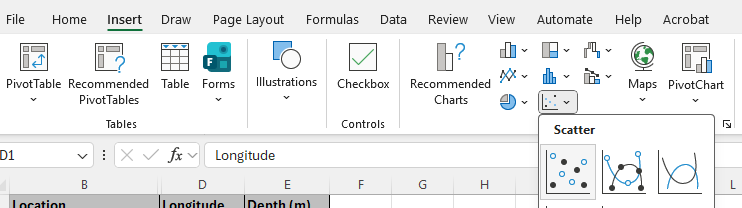
- Select ‘Chart design’ in the top ribbon and then ‘Add chart element’ to add a title for the graph and axis labels.
- If the numbers on the axis need to be moved (they may appear at the top of the chart rather than the bottom), double click on the numbers and then select ‘Axis options’ > the graph symbol > ‘Labels’ to change the label position.
✎ STUDENT NOTES: Paste the graph into your notebook.
TRAAP method
The TRAAP method is a useful strategy for evaluating the quality and reliability of scientific information.
The TRAAP method is a useful strategy for evaluating the quality and reliability of scientific information by focusing on five key criteria: Timeliness, Relevance, Authority, Accuracy, and Purpose.
- Timeliness refers to whether the information is up to date, which is especially important in science, where new discoveries can quickly render older data outdated.
- Relevance checks if the information is directly related to your scientific topic or research question.
- Authority looks at the author’s or publisher’s qualifications—scientific sources should come from experts or reputable institutions.
- Accuracy involves checking whether the information is supported by scientific evidence, such as data, experiments, or peer-reviewed research.
- Purpose helps identify why the information was published—whether it aims to inform using objective evidence, or if it has bias, like promoting a product or opinion.
For example, when researching the environmental impact of plastic pollution in oceans, you identify a recent article in Nature written by marine biologists that includes data from recent field studies. Using the TRAAP method, you would determine the article as timely (recently published), relevant to your topic, written by experienced marine scientists, accurate (as Nature is peer-reviewed), and its purpose is to inform other scientists. In contrast, a 2010 article from a non-scientific blog that lacks data and cites no sources would fail several TRAAP criteria, making it unreliable for scientific research.
The Inquire phase allows students to cycle progressively and with increasing complexity through the key science ideas related to the core concepts. Each Inquire cycle is divided into three teaching and learning routines that allow students to systematically build their knowledge and skills in science and incorporate this into their current understanding of the world.
When designing a teaching sequence, it is important to consider the knowledge and skills that students will need in the final Act phase. Consider what the students already know and identify the steps that need to be taken to reach the level required. How could you facilitate students’ understanding at each step? What investigations could be designed to build the skills at each step?
Read more about using the LIA FrameworkFollowing an investigation, the Integrate routine provides time and space for data to be evaluated and insights to be synthesized. It reveals new insights, consolidates and refines representations, generalises context and broadens students’ perspectives. It allows student thinking to become visible and opens formative feedback opportunities. It may also lead to further questions being asked, allowing the Inquire phase to start again.
When designing a teaching sequence, consider the diagnostic assessment that was undertaken during the Launch phase. Consider if alternative conceptions could be used as a jumping off point to discussions. How could students represent their learning in a way that would support formative feedback opportunities? Could small summative assessment occur at different stages in the teaching sequence?
Read more about using the LIA FrameworkMathematical models
(Slide 30) Discuss how the graph shows the places the two plates are moving against each other.

NOTE: The line of earthquakes is an indication of the two boundaries rubbing against each other. The right-hand plate is moving underneath the left-hand plate.
- What does the y-axis (vertical axis) show?
- The depth below Earth’s surface.
- Where is the sea level on the graph?
- 0 m elevation. If required, have students draw the Earth’s surface at 0 metres to emphasise that everything is happening below their feet.
- What do you notice about the shape of the graph?
- The graph shows that one plate (Pacific plate) is moving/subducting under the Indo-Australian plate.
- Which plate is moving downwards?
- The Pacific plate is moving downwards.
- What type of tectonic boundary is this?
- Subduction.
Discuss how deep the subducting plate is located and how gravitational force can pull on the end of this plate in a process called slab pull. Emphasise that this is occurring at the same rate as fingernails grow.
- What do you think happens to the plate that is ‘hanging down’?
- It keeps being pulled down and can break off and become part of the mantle.
- What effect do you think this pull at the end of the tectonic slab has an effect on the rest of the plate?
- It can provide a pull force on the whole tectonic plate.
- How do you think this force compares to the force provided by convection?
- Slab pull is a stronger force than the convection force.
(Slide 31) ✎ STUDENT NOTES: Define slab pull as the gravitational force that pulls down on a dense cold oceanic plate that is subducting beneath another plate. This is the main driver of tectonic plate movement.
Pose the question: What does this look like on a map?
Invite students to go to the Geoscience Australia Portal 3D map.
(Slide 32) Select ‘Layers’ > ‘3D layers’ > ‘Hazards, scenarios and risks’ > ‘Natural Hazards, Scenarios and Risks’ > ‘Earthquakes and Seismic Hazards, Scenarios and Risks’ > ‘Historic earthquakes (Global)’ > ‘Add to Map’.
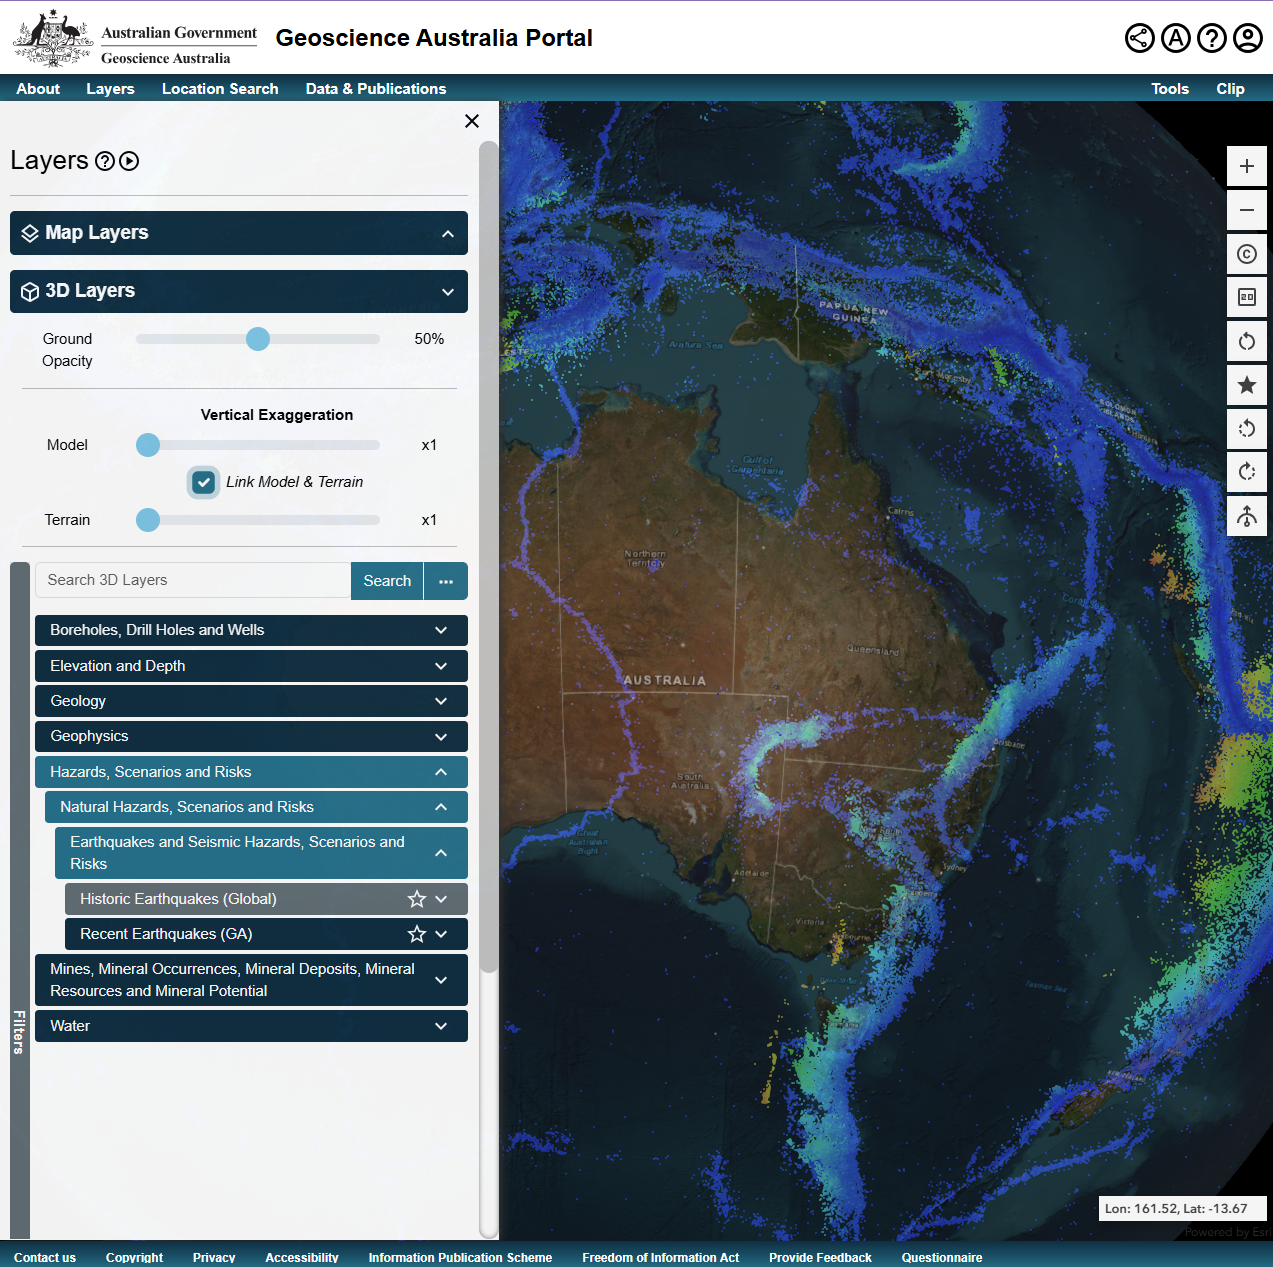
Rotate the world map to locate New Zealand. If required, increase ‘Ground Opacity’ to 60-70% to make it easier to see earthquake locations.
Identify the subduction zone north of New Zealand and the different colours indicating the different depths of an earthquake. Relate the colours of the earthquake dots to the depth on Slide 30. Emphasise that each dot is a historical earthquake.
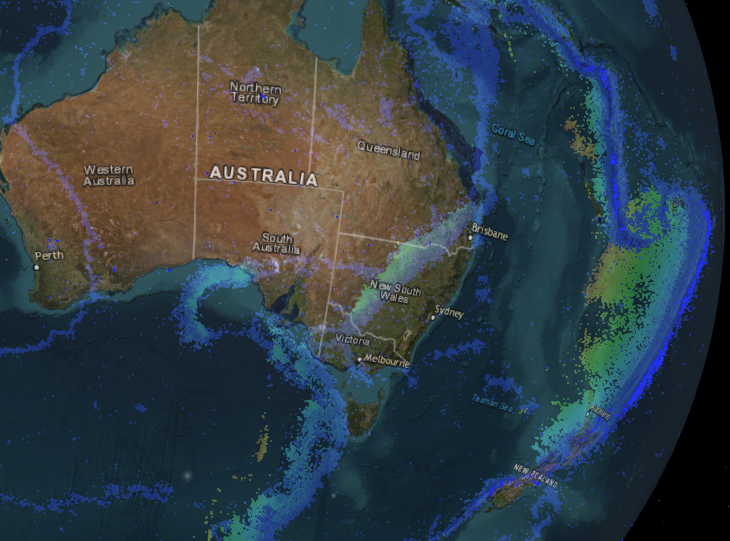
Challenge students to rotate the Earth and locate other subduction zones. Discuss which representation (the graph or the 3D map) provides the most information for:
- educational purposes.
- scientific purposes (identifying types of boundaries).
(Slide 33) ✎ STUDENT NOTES: Draw a table identifying the advantages and disadvantages of the graphical model and the 3D model.
| Model | Graph | 3D map |
| Advantages | ||
| Disadvantages |
Look for places where lines of shallow earthquakes happen in the lithosphere below the ocean. These zones are where plates are pulling apart along a divergent plate margin. Students may need to adjust the opacity to ~25% to see the dots that represent earthquakes on the surface.
Discuss how the magma comes to the surface at a divergent boundary and forms ocean ridges.
- What happens when the plates move apart?
- The magma comes to the surface and forms ocean ridges.
- Do you think that this has any effect on how the plates move?
- Yes. This can add a push force to the plates moving apart.
(Slide 34) ✎ STUDENT NOTES: Define ‘ocean ridge push’ as the force that pushes tectonic plates apart at a divergent boundary.
(Slide 35) ✎ STUDENT NOTES: Draw a mind map of everything learned so far on earthquakes, their causes and tectonic plate boundaries.
Optional: Identify the following boundaries on the 3D map:
- Convergent boundaries:
- subduction north of NZ
- ocean/continental Andes
- continental/continental Himalayas
- oceanic/oceanic Caribbean Islands
- Divergent boundaries:
- mid Atlantic ridge (magnetic stripes)
- Northern Ethiopia Y shape rift
- Transformation boundaries (shallow earthquakes as the plates slide horizontally against each other):
- San Andreas fault (west coast USA)
- Anatolian Fault (along the northern and easter edges of Turkey)
- Alpine Fault (New Zealand South Island)
- Altyn Tagh Fault (Central Asia)
Reflect on the lesson
You might invite students to:
- examine the lack of earthquake zones in Australia.
- identify areas where major earthquakes could be expected.
- research the case of Italian geoscientists that were charged for not predicting a major earthquake.
Scientific models
There are many different reasons that models are used in science.
There are many different reasons that models are used in science. Models may be physical (globe or skeleton), mathematical (equations that represent relationships), computerised (global warming), or conceptual (diagram of the water cycle).
Models can be used to:
- understand complex systems by breaking large systems into manageable parts. For example, climate models can be used to simulate Earth’s atmosphere and oceans to understand weather patterns and climate change.
- make predictions about how different conditions would affect the outcome. For example, models of disease spread help to predict how a new illness could move through a population.
- safely test hypotheses that might be too dangerous, expensive, or unethical to test in real life. For example, car test simulations.
- communicate ideas through visualising and explaining difficult concepts. For example, the Bohr model of the atomis used by students.
- explore things that can’t be directly observed due to being too large or too small. For example, to model the solar system or the structure of DNA.
All models have limitations, and it is useful to discuss these with students whenever the models are used.