Bushfire and ice
View Sequence overviewStudents will:
- examine the impact a bushfire has on people in the community.
- explore how the prevalence of bushfires varies across Australia and vegetation types.
- use argumentation to justify a claim on the main cause of bushfires.
Students will represent their understanding as they:
- use an empathy map to explore the impacts of bushfire on a community.
- group and classify different Australian vegetation types.
- use argumentation to defend a decision on the main cause of bushfires.
In the Launch phase, assessment is diagnostic.
Take note of students’ understanding and ability to:
- describe a bushfire.
- identify emotions from people’s conversations and body language, and respond effectively.
- construct an argument.
- provide alternative explanations for a satellite observed hotspot.
Whole class
Bushfire and ice Resource PowerPoint
Sticky notes
Access to internet and YouTube for videos on bushfires
Australian ecosystems answers sheet
Each group
Set of photos from Australian ecosystems Resource sheet (these photos could be laminated and cut for reuse)
Trustworthy Resources sheet (optional)
Each student
Individual Science notebook
Bushfire empathy map
Lesson
The Launch phase is designed to increase the science capital in a classroom by asking questions that elicit and explore students’ experiences. It uses local and global contexts and real-world phenomena that inspire students to recognise and explore the science behind objects, events and phenomena that occur in the material world. It encourages students to ask questions, investigate concepts, and engage with the Core Concepts that anchor each unit.
The Launch phase is divided into four routines that:
- ensure students experience the science for themselves and empathise with people who experience the problems science seeks to solve (Experience and empathise)
- anchor the teaching sequence with the key ideas and core science concepts (Anchor)
- elicit students’ prior understanding (Elicit)
- and connect with the students’ lives, languages and interests (Connect).
Students arrive in the classroom with a variety of scientific experiences. This routine provides an opportunity to plan for a common shared experience for all students. The Experience may involve games, role-play, local excursions or yarning with people in the local community. This routine can involve a chance to Empathise with the people who experience the problems science seeks to solve.
When designing a teaching sequence, consider what experiences will be relevant to your students. Is there a location for an excursion, or people to talk to as part of an incursion? Are there local people in the community who might be able to talk about what they are doing? How could you set up your classroom to broaden the students’ thinking about the core science ideas? How could you provide a common experience that will provide a talking point throughout the sequence?
Read more about using the LIA FrameworkBushfire impact
Introduce the topic of bushfires by:
- recognising any recent local bushfires.
- identifying students who may have had friends or family affected by bushfires.
- discussing the importance of understanding and planning for bushfires in the future.
(Slide 3) Explain to students the purpose of an empathy map: to capture the attitudes and behaviours of people experiencing challenges such as bushfire.
Divide the students into groups and allocate one section of the Bushfire empathy map to each group (Think, Feel, Say, Do). Explain that each group should capture what they see and hear in their notebooks during the discussion or watching the video.
Discuss with students recent bushfires in your area or show a video of a recent bushfire. For example: Homes lost and damaged in bushfire that’s ravaged Perth's north | 9 News Australia (1:07). Each group should:
- Think: Listen for phrases that identify what people are thinking. These phrases usually start with “I think…’ or ‘I believe…’.
- Feel: Watch the expressions of the people in the video. Do they look helpless, happy, thankful, sad? What are they talking about when they show these emotions?
- Say: What are people saying during the video? Write direct quotes or key phrases of what is being said. Make sure you note what they are referring to in each quote.
- Do: Identify the people in the video (foreground and background) and how they are related to each other. What are people doing in the videos? How are they acting before, during and after they speak?
✎ STUDENT NOTES: Complete the allocated section of the Bushfire empathy map.
Encourage individual groups to compare their observation notes for their section of the empathy map. Groups then share their observations with the class.
Provide each group with sticky notes to record the group’s observations for their section of the empathy map. Collate the observations into a whole class empathy map.
Identify similar ideas/observations in each quarter of the map and cluster them together. Discuss the observations that students made. Encourage students to record the class observations in their individual empathy maps.
- What did the people say about the bushfire? How did they describe what happened?
- Did what they say match their thinking?
- Did they describe or think about what had happened (the past)?
- Did they describe or think about what was happening around them (the present)?
- Did they describe or think about what they needed to do next (the future)?
- Did their thoughts match their actions (the ‘do’)?
- How did you feel watching the video? Did your emotions mirror that of the people in the video?
- What strategies could you use to manage your emotions?
- Would these strategies help if you were talking with people affected by the bushfire directly? Why or why not?
✎ STUDENT NOTES: Update all sections of the Bushfire empathy map with the class observations.
Adapting to your context
Consider students’ previous bushfire experiences when adapting the context or planning support that might be needed.
Many areas of Australia have experienced bushfires. There is the potential for some students to be sensitive to reliving the emotions experienced. This teaching sequence aims to provide students with a chance to positively channel these emotions into understanding and action.
The videos have been chosen for their interviews with the local people involved in the bushfire emergency. This is an opportunity for students to empathise with people directly affected and to generate an empathy map. It is worth considering how different students in the class may be affected by viewing the footage.
Consider your students when teaching this sequence and plan for any support that might be needed through the appropriate school channels.
Core concepts and key ideas
When planning for teaching in your classroom, it can be useful to see where a sequence fits into the larger picture of science.

When planning for teaching in your classroom, it can be useful to see where a sequence fits into the larger picture of science. This unit is anchored to the Science Understanding core concepts for Earth and Space sciences.
- The Earth system comprises dynamic and interdependent systems; interactions between these systems cause continuous change over a range of scales; all living things are connected through Earth’s systems and depend on sustainability of the Earth system.
By Year 9, students have already examined the rates of change of days and seasons (Year 1), compared soils (Year 3) and their weathering (Year 5) and the cycle of water (Year 4). In Year 9, this involves representing the carbon cycle and examining how key processes including combustion, photosynthesis and respiration rely on interactions between Earth’s spheres (the geosphere, biosphere, hydrosphere and atmosphere).
This core concept is linked to the key science ideas:
- Changes and rates of change of bushfires can be quantified and modelled at different scales (Stability and change)
- Orders of magnitude can show how a model at one scale (bushfires and model ice core) relates to a model at another scale (Scale and measure)
- The pattern of changing carbon dioxide levels can be observed over 800,000 years and compared to changes in the last 50 years (Patterns, order and organisation)
- Form and function of a bushfire is determined by the form, functions and interconnections of weather, fuel load and topography (form and function)
- Energy of photosynthesis, respiration and combustion drive cycling of matter within and between carbon cycle systems (Systems)
- Models of bushfires can be used to predict the behaviour of a system (Systems)
- The accuracy and reliability of bushfire predictions is dependent upon the assumptions and approximations in a model (Systems)
When your students next progress through this core concept, they will use models of energy flow between the geosphere, biosphere, hydrosphere and atmosphere to explain patterns of global climate change (Year 10).
The Launch phase is designed to increase the science capital in a classroom by asking questions that elicit and explore students’ experiences. It uses local and global contexts and real-world phenomena that inspire students to recognise and explore the science behind objects, events and phenomena that occur in the material world. It encourages students to ask questions, investigate concepts, and engage with the Core Concepts that anchor each unit.
The Launch phase is divided into four routines that:
- ensure students experience the science for themselves and empathise with people who experience the problems science seeks to solve (Experience and empathise)
- anchor the teaching sequence with the key ideas and core science concepts (Anchor)
- elicit students’ prior understanding (Elicit)
- and connect with the students’ lives, languages and interests (Connect).
The Elicit routine provides opportunities to identify students’ prior experiences, existing science capital and potential alternative conceptions related to the Core concepts. The diagnostic assessment allows teachers to support their students to build connections between what they already know and the teaching and learning that occurs during the Inquire cycle.
When designing a teaching sequence, consider when and where students may have been exposed to the core concepts and key ideas in the past. Imagine how a situation would have looked without any prior knowledge. What ideas and thoughts might students have used to explain the situation or phenomenon? What alternative conceptions might your students hold? How will you identify these?
The Deep connected learning in the ‘Pedagogical Toolbox: Deep connected learning’ provides a set of tools to identify common alternative conceptions to aid teachers during this routine.
Read more about using the LIA FrameworkBushfires across Australia
(Slide 4) Identify what students know about bushfires, where they occur and how they behave.
- Has Australia always had bushfires?
- Why are we so worried about bushfires now?
- What makes a fire a bushfire?
- Is a fire in grassland called a bushfire? Why? Why not?
- Do bushfires occur in all parts of Australia?
- What different types of environments occur across Australia?
- Do you think a fire behaves the same in all environments? Why do you think that?
(Slide 5) Divide students into groups and provide each group with a set of the ecosystem photos in the Australian ecosystems Resource sheet. Ask students to group the photos into similar environments and to identify a title for each category.
(Slide 6) Discuss how students sorted and named the categories, and how they were similar and different across each group.
- How did your group decide the categories?
- How did the categories vary between each group of students? What was similar and what was different?
- Is there one environmental category that would be most at risk of bushfire?
- What evidence would you need to support your claim?
(Slide 7) Show the map of Australia that illustrates the different climate zones of Australia, including the savanna woodland zone, savanna grassland zone, and temperate grassland zone, and the frequency of fires.

Discuss the definition of each environment type, referring back to and comparing it to each of the Australian environment images students just sorted.
- Black outline: savanna woodland zone—scattered trees and shrubs forming a light canopy
- Green outline: savannah grassland zone—little to no trees or shrubs
- Red outline: temperate grassland zone—hot summers and cold winters produce grassland with occasional eucalyptus trees
Identify that temperate woodland (trees and shrubs that provide a canopy in variable climates that are cold in winter) and rainforests (closed canopies with moisture-dependent plant-life) are not shown on this map. Discuss how the solid colours represent the fire frequency.
Allow students the opportunity to re-categorise their photos as required.
Suggested answers are provided in Australian ecosystems Teacher resource sheet
(Slide 8) Lead a discussion to draw out the correlation between the identified environment zone and the frequency of fire, and why this may occur.
- What are the features of the three types of environments?
- Which environment zone are we located in?
- Identify the environment pictures that are relevant to your local environment. Discuss the similarities and differences.
- Do the descriptions/images fit with your experience/understanding of our local area?
- Some students who live in suburban areas may have a limited or artificial experience of the environment zone in which they live. They may only have seen and experienced man-made suburban areas and will need support, via reference to the images, to build a picture of what these environments look like.
- Which zones have the most fires recorded between 1988-2019?
- Savanna woodlands. This may come as a surprise to students as the media generally reports on bushfires in heavily populated areas in the southern parts of Australia.
✎ STUDENT NOTES: Working in groups, identify and record what you know about how bushfires behave in each of these environments.
- What (in the pictures) will burn in a bushfire?
- What makes a bushfire more dangerous in our environment?
- How do bushfires spread?
- What makes a bushfire spread faster?
- Have we always had bushfires in our area??
- Are bushfires occurring more often?
- What causes most bushfires?
✎ STUDENT NOTES: Record any questions about the ways bushfires behave in different environments.
Alternative conceptions
What alternative conceptions should you look for?
Students may have a variety of misconceptions about how fire behaves, including that it spreads faster in bushland and that embers do not travel far.
One of the key factors that contribute to the spread of a bushfire is wind. This means a fire can spread rapidly across a grassland because there is little to interrupt the flow and direction of the wind. The wind can also carry embers (burning bark, leaves, and seed pods) long distances. Sometimes, the wind high in the atmosphere (the outer edges of the troposphere, 1-10 km above the surface) can carry the embers in a different direction than that of the fire front. This means that houses away from the leading edge of the fire can still be in danger of being burnt.
While many Australian trees can provide an explosive reaction in a bushfire, the wind speed is often greater in an open area where there is grassland and fewer trees. Flying embers light the fine fuel on the ground. These small fires then climb the ladder of materials up a tree truck to the canopy. Overlapping canopies have high surface areas and often strong winds, allowing the canopy fire to spread quickly to other trees. If the canopy is not overlapping, the embers will fall to the ground and spread to the next tree ladder.
Q-matrix
Question stems encourage students to generate useful questions.

The Q-matrix presents a series of question stems that can be used to generate useful questions. From left to right, and top to bottom, the presented stems prompt questions from fact-based to analytical. Questions posed using the stems in the top left corner are more likely to be closed, while those in the bottom right are more likely to be open. In generating responses to questions toward the bottom right of the matrix, students are more likely to be required to explain, analyse, justify, and evaluate data and information. It should be noted though, that some of the usefulness of the Q-matrix rests in valuing students’ questions, without the requirement that students then find resolutions.
The question stems are best introduced using the familiar first-word prompts across the top of the matrix (what, where/when, which, who, why, how).
The Launch phase is designed to increase the science capital in a classroom by asking questions that elicit and explore students’ experiences. It uses local and global contexts and real-world phenomena that inspire students to recognise and explore the science behind objects, events and phenomena that occur in the material world. It encourages students to ask questions, investigate concepts, and engage with the Core Concepts that anchor each unit.
The Launch phase is divided into four routines that:
- ensure students experience the science for themselves and empathise with people who experience the problems science seeks to solve (Experience and empathise)
- anchor the teaching sequence with the key ideas and core science concepts (Anchor)
- elicit students’ prior understanding (Elicit)
- and connect with the students’ lives, languages and interests (Connect).
Science education consists of a series of key ideas and core concepts that can explain objects, events and phenomena, and link them to the experiences encountered by students in their lives. The purpose of the Anchor routine is to identify the key ideas and concepts in a way that builds and deepens students’ understanding. During the Launch phase, the Anchor routine provides a lens through which to view the classroom context, and a way to frame the key knowledge and skills students will be learning.
When designing a teaching sequence, consider the core concepts and key ideas that are relevant. Break these into small bite-sized pieces that are relevant to the age and stage of your students. Consider possible alternative concepts that students might hold. How could you provide activities or ask questions that will allow students to consider what they know?
Lightning, people and bushfires
Pose the question: What is the main cause of bushfires?
Ask students to list all the possible causes of bushfires. Collect their ideas on sticky notes or written on a board.
Group these ideas into a few categories. These could include accidental, arson, natural/storms/lightning, hazard reduction etc.
(Slide 9) Identify the two claims that ‘people’ or ‘lightning’ are the main causes of bushfires.
Discuss what evidence would be needed to make a claim about which category is the main cause of a bushfire.
(Slide 10) Discuss the lightning density map as evidence for one of the claims.
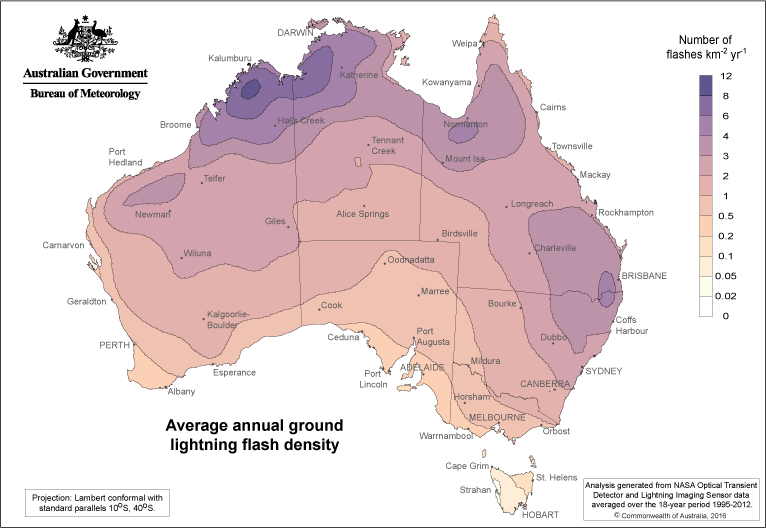
- What is this map showing?
- Average annual number of lightning flashes that make contact with the ground.
- What do the numbers represent?
- The number of times lightning was recorded from the International Space Station Lightning Imaging Sensor.
- Is it from a reliable source? How do we know?
- Where does the most frequent lightning occur?
- Northern parts of Australia.
- Why do you think this occurs?
- More likely to have big storms in this area.
(Slide 11) Display or distribute a copy of the Trustworthy resources Resource sheet. Discuss the reliability of each form of evidence and how it could be used to support one of the original two claims.
Discuss the importance of identifying the source of data and the reliability of the source. Links are provided so that the websites can be evaluated. Students should identify that the blogs do not provide data to back their claims and therefore cannot be used as evidence.
- Where does each of these pieces of information come from?
- Who can we tell if the source of the data is reliable?
- The blogs are not backed by data that is rigorously collected and represented. They do not provide where their information comes from. Pictures are designed to evoke emotions rather than provide information. These are not reliable sources.
- What does the evidence show?
- The number of arson attacks is increasing. Evidence of bushfires show largest single cause of bushfires is lightning.
Optional: The chart from the United Nations Office for Disaster Risk Reduction is originally sourced from an article in The Conversation that was produced by a Monash University Honours student (in collaboration with their supervisors). Curious students can be encouraged to locate the original source of the work.
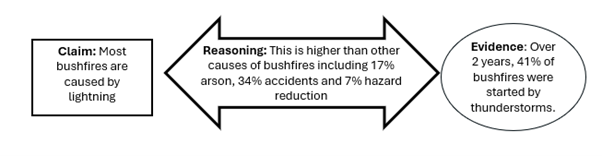
(Slide 12) Introduce the key elements of argumentation including making a claim, supplying evidence that supports the claim, and reasoning that links the evidence to the claim.
✎ STUDENT NOTES: Make a claim about the main cause of bushfires, providing reliable evidence (Slides 13 and 14) and reasoning to support the claim.
(Slide 15) Some students may agree that both claims are correct. The focus is on the reasoning they use to support their decision.
- What do you think is the main cause of bushfires?
- Why do you think that?
- What evidence did you use to make your decision?
- How does that link to the claim?
- Can you think of another argument for your view?
- Can you think of evidence that might make you rethink your decision?
Argumentation
Argumentation is the process of systematically providing reasoning to support a claim.
Argumentation is the process of systematically providing reasoning to support a claim. Unlike the commonly used negative term ‘argument’, argumentation involves developing a valid argument or persuasive idea.
At the simplest level, students should be able to provide a claim, evidence, and reasoning.
At higher levels, students will be able to identify the limitations of a claim, the underlying assumptions that back the claim, and provide a rebuttal for any counterclaims.
In this lesson, students working at a higher level should be able to identify the following in regards to the data shown on Slide 14:
Limitations: This data was during a 20-year period (2000-2019) in Australia. It does not indicate what has happened since that time.
Backing: This is historical data from forensic research by Victoria’s Department of Environment, Land, Water and Planning. If the data was related only to media reports, then it would decrease the quality of the evidence.
Counter-claim: most bushfires are caused by people (17% Arson, 34% accidents, 7% hazard reduction).
This process suggests that the original claim could be modified to “The single biggest cause of bushfire is lightning".
The Launch phase is designed to increase the science capital in a classroom by asking questions that elicit and explore students’ experiences. It uses local and global contexts and real-world phenomena that inspire students to recognise and explore the science behind objects, events and phenomena that occur in the material world. It encourages students to ask questions, investigate concepts, and engage with the Core Concepts that anchor each unit.
The Launch phase is divided into four routines that:
- ensure students experience the science for themselves and empathise with people who experience the problems science seeks to solve (Experience and empathise)
- anchor the teaching sequence with the key ideas and core science concepts (Anchor)
- elicit students’ prior understanding (Elicit)
- and connect with the students’ lives, languages and interests (Connect).
Each student comes to the classroom with experiences made up from science-related knowledge, attitudes, experiences and resources in their life. The Connect routine is designed to tap into these experiences and that of their wider community. It is also an opportunity to yarn with community leaders (where appropriate) to gain an understanding of the student’s lives, languages and interests. In the Launch phase, this routine identifies and uses the science capital of students as the foundation of the teaching sequence so students can appreciate the relevance of their learning and its potential impact on future decisions. In short, this routine moves beyond scientific literacy and increases the science capital in the classroom and science identity of the students.
When planning a teaching sequence, take an interest in the lives of your students. What are their hobbies, how do they travel to and from school? What might have happened in the lives of your students (i.e. blackouts) that might be relevant to your next teaching sequence? What context might be of interest to your students?
Read more about using the LIA FrameworkMake it local
(Slide 16) Demonstrate how the Firewatch website uses satellites to detect hotspots across Australia over the previous 72 hours. A hotspot is an area of high infrared intensity that is detected by satellite image. This means it could be a heat source such as heavy industry and gas fires. A bushfire may not be visible if there is a lot of smoke or cloud, or the fire is too cool.
Zoom the map into the local area to identify any potential hotspots in your local area.
NOTE: Vegetation maps can be selected on the LHS of the image. Vegetation is updated weekly and is sourced through google maps. Burnt areas for the year can also be selected (updated monthly).
Use the local government incident updates to identify if there has/is a fire in the area, or if there is another cause for the hotspot.
(Slide 17) Discuss the potential impact if a fire was to occur in your local area.
- If we had a bushfire in our area, where would it likely occur?
- What might be the cause?
- Who might be most affected?
- How might they be affected, either directly or indirectly?
- Directly includes loss of home, loss of work, loss of family, and health effects of bushfire smoke (people with lung disease/asthma/cardiac disease/babies and young children, elderly, etc).
- Indirectly includes mental health issues (including anxiety), disrupted schooling, and loss of community.
Optional: Invite a local firefighter into the classroom for an interview.
✎ STUDENT NOTES: Record the discussion using a T-diagram.

Outline the Act(ion) that students will take at the end of this teaching sequence.
Students will prepare a fire action plan for themselves, members of their community or visitors to the region. This could take the form of:
- Persuasive texts
- Infographics
- Video presentation
- Brochures
- Storybook
- Advertisements
- News broadcast
- Website page
- Public education campaign
- Local environment plan
Reflect on the lesson
Students might investigate the last bushfire that was in their area and write a short news article that includes:
- the area burnt.
- the effort taken to get the fire under control.
- who was affected.
- how they were affected.
- any recovery efforts that were made to support plants and animals.