Bushfire and ice
View Sequence overviewStudents will:
- examine ice core data that records the changes in global temperature over time.
- compare global temperature changes with global changes in carbon dioxide levels.
Students will represent their understanding as they:
- use argumentation to make claims about changes in global temperature over 800,000 years.
- outline the difference between correlation and causation.
- research the impacts of global climate change.
In this lesson, assessment is formative.
Feedback might focus on:
- the difference between correlation and causation.
- how different times scales can impact results.
Potential summative assessment
Students working at the achievement standard should:
- explain how scientific knowledge is validated and refined, including the role of publication and peer review.
- select and construct appropriate representations to organise, process and summarise data and information.
- analyse and connect data and information to identify and explain patterns, trends, relationships, and anomalies.
- analyse the impact of assumptions and sources of error in methods and evaluate the validity of conclusions and claims.
- construct logical arguments based on evidence to support conclusions and evaluate claims.
- select and use content, language, and text features effectively to achieve their purpose when communicating their ideas, findings, and arguments to specific audiences.
Refer to the Australian Curriculum content links on the Our design decisions tab for further information.
Whole class
Bushfire and ice Resource PowerPoint
Each student
Individual science notebook
Correlating CO₂ levels with average temperature in the Antarctic ice core Resource sheet
Lesson
The Inquire phase allows students to cycle progressively and with increasing complexity through the key science ideas related to the core concepts. Each Inquire cycle is divided into three teaching and learning routines that allow students to systematically build their knowledge and skills in science and incorporate this into their current understanding of the world.
When designing a teaching sequence, it is important to consider the knowledge and skills that students will need in the final Act phase. Consider what the students already know and identify the steps that need to be taken to reach the level required. How could you facilitate students’ understanding at each step? What investigations could be designed to build the skills at each step?
Read more about using the LIA FrameworkRe-orient
Recall the stages in the carbon cycle where carbon can spend a lot of time (slow carbon cycle).
Discuss how industry uses fossil fuels that release carbon dioxide.
The Inquire phase allows students to cycle progressively and with increasing complexity through the key science ideas related to the core concepts. Each Inquire cycle is divided into three teaching and learning routines that allow students to systematically build their knowledge and skills in science and incorporate this into their current understanding of the world.
When designing a teaching sequence, it is important to consider the knowledge and skills that students will need in the final Act phase. Consider what the students already know and identify the steps that need to be taken to reach the level required. How could you facilitate students’ understanding at each step? What investigations could be designed to build the skills at each step?
Read more about using the LIA FrameworkIdentifying and constructing questions is the creative driver of the inquiry process. It allows students to explore what they know and how they know it. During the Inquire phase of the LIA Framework, the Question routine allows for past activities to be reviewed and to set the scene for the investigation that students will undertake. The use of effective questioning techniques can influence students’ view and interpretation of upcoming content, open them to exploration and link to their current interests and science capital.
When designing a teaching sequence, it is important to spend some time considering the mindset of students at the start of each Inquire phase. What do you want students to be thinking about, what do they already know and what is the best way for them to approach the task? What might tap into their curiosity?
Read more about using the LIA FrameworkClimate vs weather
Pose the question: What keeps carbon dioxide in the atmosphere? Why does it not fly off into space?
Discuss how Earth’s gravity keeps the gases in the atmosphere close to the Earth’s surface and that the gases act like a greenhouse, keeping the Earth warm.
- Why does the Earth have an atmosphere, while other planets do not?
- The Earth has a gravitational force that keeps the atmosphere close. The first gases in our atmosphere came from volcanoes, and gravitational force kept them close. Other planets did not have enough gravitational force or did not produce and keep the gases produced.
- Why is the atmosphere important?
- It protects the surface of the Earth from the worst of the solar radiation from the Sun (the atmosphere reflects much of the radiation) and keeps us warm like a greenhouse.
- What would happen if we did not have an atmosphere?
- We would be similar to the Moon (which has little atmosphere) with a temperature range of -133℃ to 121℃.
Discuss the difference between weather (the day-to-day variation in temperature, sunlight, wind, and rain) and climate (average conditions over very long periods).
✎ STUDENT NOTES: Describe the difference between daily temperature (part of the weather) and the average monthly or yearly temperature (climate).
Pose the question: How do carbon dioxide levels correlate with the changing climate of the Earth?
The Inquire phase allows students to cycle progressively and with increasing complexity through the key science ideas related to the core concepts. Each Inquire cycle is divided into three teaching and learning routines that allow students to systematically build their knowledge and skills in science and incorporate this into their current understanding of the world.
When designing a teaching sequence, it is important to consider the knowledge and skills that students will need in the final Act phase. Consider what the students already know and identify the steps that need to be taken to reach the level required. How could you facilitate students’ understanding at each step? What investigations could be designed to build the skills at each step?
Read more about using the LIA FrameworkThe Investigate routine provides students with an opportunity to explore the key ideas of science, to plan and conduct an investigation, and to gather and record data. The investigations are designed to systematically develop content knowledge and skills through increasingly complex processes of structured inquiry, guided inquiry and open inquiry approaches. Students are encouraged to process data to identify trends and patterns and link them to the real-world context of the teaching sequence.
When designing a teaching sequence, consider the diagnostic assessment (Launch phase) that identified the alternative conceptions that students held. Are there activities that challenge these ideas and provide openings for discussion? What content knowledge and skills do students need to be able to complete the final (Act phase) task? How could you systematically build these through the investigation routines? Are there opportunities to build students’ understanding and skills in the science inquiry processes through the successive investigations?
Read more about using the LIA FrameworkGraphing average global temperatures
Discuss how the temperature on Earth has changed over time, including ice ages.
- Has the temperature of the Earth always been the same?
- No. The Earth has experienced ice ages in the past.
- Does anyone know when was the last ice age?
- 11,700 years ago.
- What do you think caused the increase and decrease in temperature in the past?
Pose the question: Is carbon dioxide to blame for the temperature variations?
Encourage the use of argumentation (Claim, Evidence, Reasoning) to discuss the type of evidence we would need to claim that carbon dioxide levels were to blame for previous increases in global temperature.
NOTE: This is only a retrospective view of climate change. Emphasise that this is not a reflection of current change in climate.
- What claims can be made about where the carbon dioxide would come from?
- Use the carbon cycle to examine how carbon dioxide could have returned to the atmosphere.
- Was there combustion of fuels 11,700 years ago?
- Except for bushfires, no.
- What evidence would we need to show that increasing carbon dioxide levels were the cause of global warming in the past?
- The carbon dioxide levels would have to increase first, before the global temperatures increased.
- Is this a reflection of what is happening now?
- No. This would be extrapolating a graph. Past conditions do not always reflect current conditions.
(Slide 50-51) Provide students with the Correlating CO2 levels with average temperature in the Antarctic ice core Resource sheet.
Allow students to examine the data and discuss their claims, evidence, and reasoning with their peers.
✎STUDENT NOTES: Allow time for students to complete the Resource sheet.
The Inquire phase allows students to cycle progressively and with increasing complexity through the key science ideas related to the core concepts. Each Inquire cycle is divided into three teaching and learning routines that allow students to systematically build their knowledge and skills in science and incorporate this into their current understanding of the world.
When designing a teaching sequence, it is important to consider the knowledge and skills that students will need in the final Act phase. Consider what the students already know and identify the steps that need to be taken to reach the level required. How could you facilitate students’ understanding at each step? What investigations could be designed to build the skills at each step?
Read more about using the LIA FrameworkFollowing an investigation, the Integrate routine provides time and space for data to be evaluated and insights to be synthesized. It reveals new insights, consolidates and refines representations, generalises context and broadens students’ perspectives. It allows student thinking to become visible and opens formative feedback opportunities. It may also lead to further questions being asked, allowing the Inquire phase to start again.
When designing a teaching sequence, consider the diagnostic assessment that was undertaken during the Launch phase. Consider if alternative conceptions could be used as a jumping off point to discussions. How could students represent their learning in a way that would support formative feedback opportunities? Could small summative assessment occur at different stages in the teaching sequence?
Read more about using the LIA FrameworkCorrelation vs causation
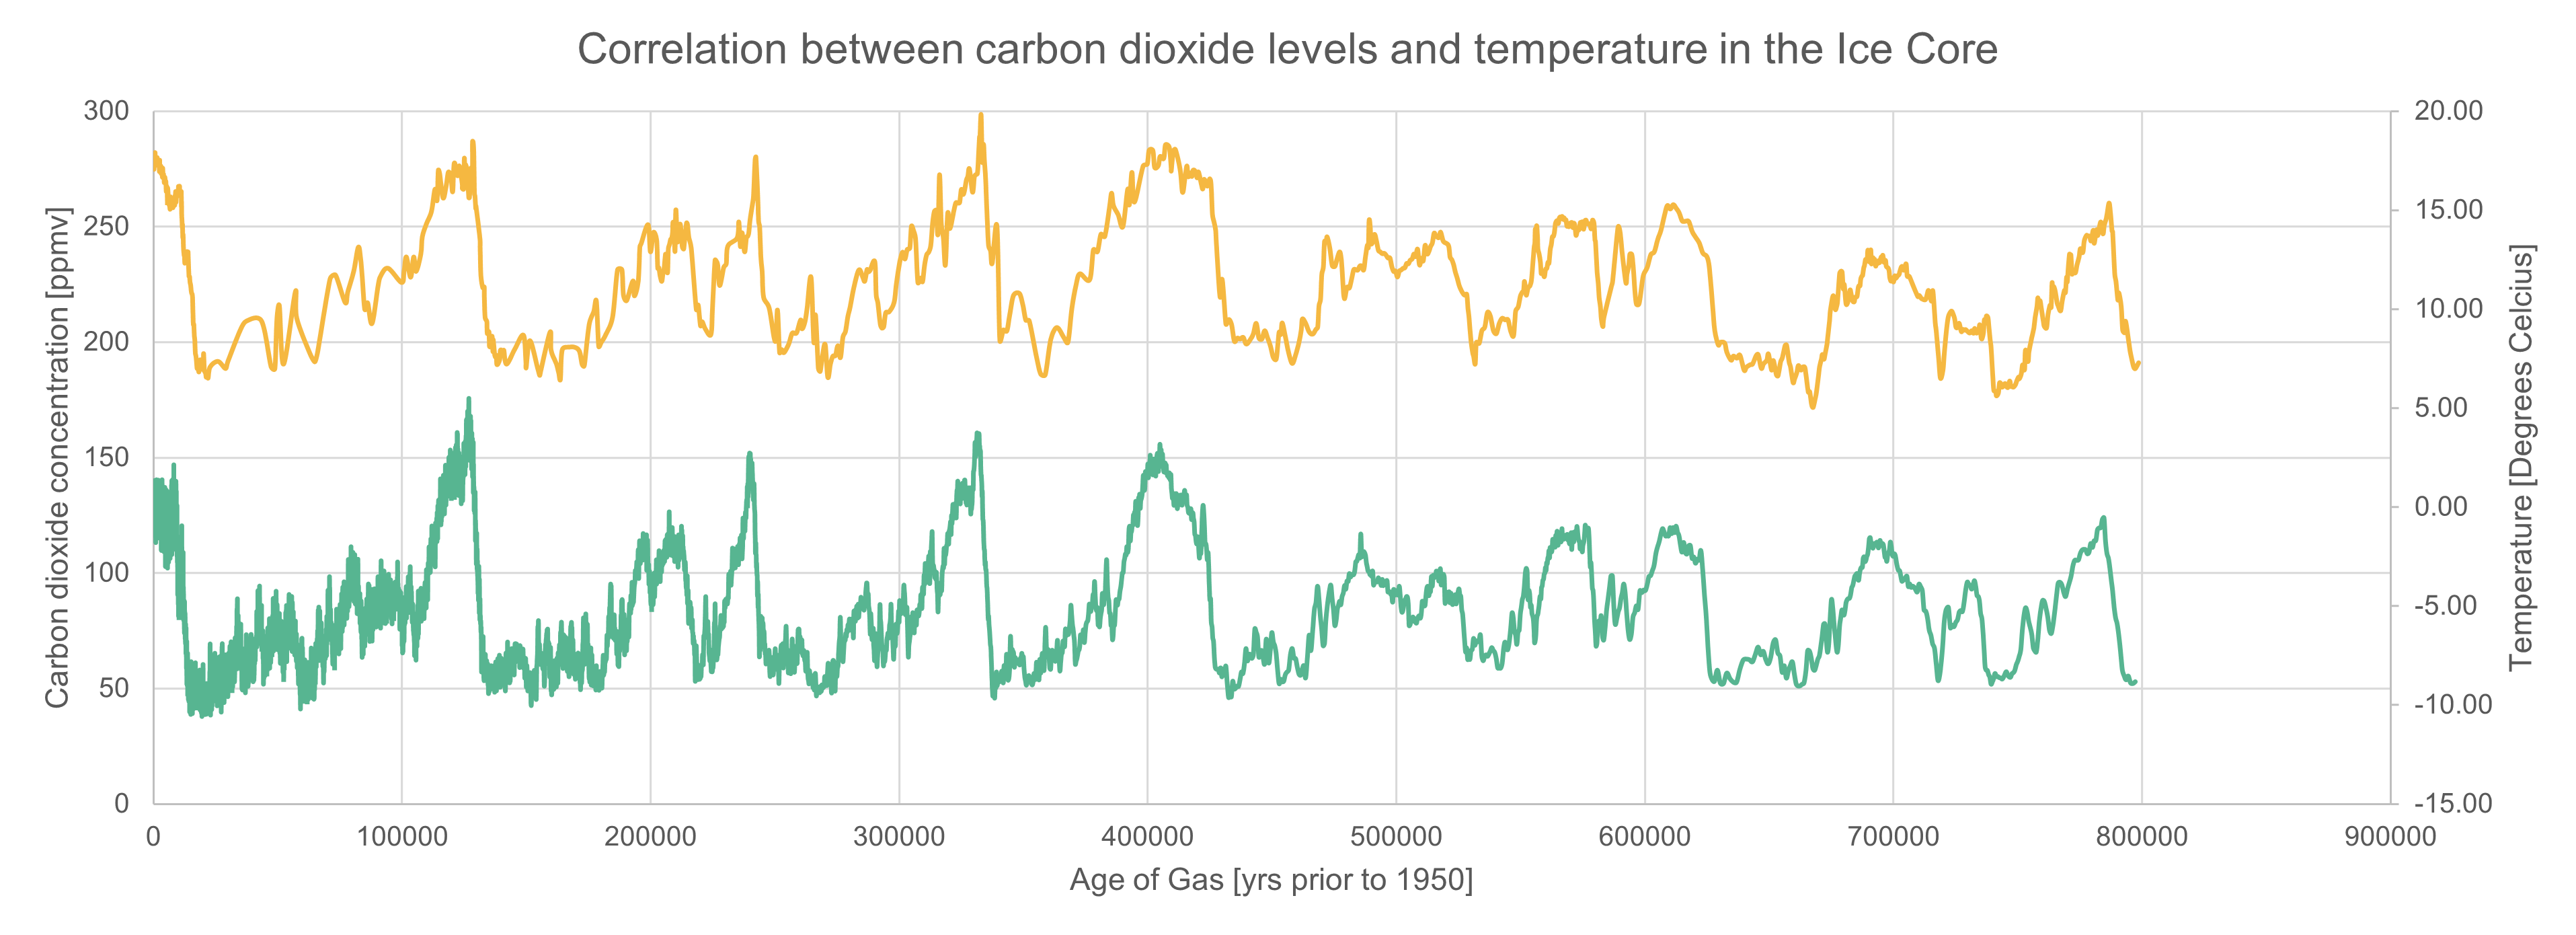
(Slide 53) Describe how there is a clear correlation between the two graphs, but that the graphs do not prove causation (the graphs do not show that one factor causes the other).
- What is the difference between correlation and causation?
- Correlation is a measure of the size and direction of a relationship between two sets of data, and causation is when one event is the result of the other event.
- Can you give an example of correlation that is not causation?
- The number of shark attacks go up every time ice-cream sales go up—both happen in hot weather, but one does not cause the other.
- How do we know when one event causes another event?
- One event usually follows another. If one event is removed, then the other will also stop. Stopping ice-cream from being sold will not stop shark attacks.
- What evidence do you have for your claim?
- From the carbon cycle game in Lesson 4, are there any possible causes of increased carbon dioxide levels?
Remind students that the data used in this lesson came from ice cores that dated before 1950 when the use of fossil fuels had increased significantly.
Show students 115 years of Australian temperatures for more recent information on changing temperatures. Hovering over a year will increase the size of that map.
(Slide 53-54) Discuss the differences between previous global warming events that took thousands of years, and the current global warming event that is occurring in 50-100 years.
- What do the maps on the 115 years of Australian temperatures chart show?
- The yearly average temperature differences from the mean (which was calculated based on 1961-1990).
- How do the first 10 years of average temperatures across Australia vary?
- That there is variation each year with almost as many ‘colder’ years as ‘warmer’ years.
- Compare the first row to the second and third row. Do we see any major differences?
- Very little differences. Equal amounts of yellow and green.
- If this is the mean, is this variation normal? What does ‘mean’ mean?
- The mean is the average, which suggests that sometimes the temperatures shown on the map are above normal and sometimes are below normal.
- Compare the average temperatures in Australia over the last 20 years (the last two rows). What do you notice?
- There is far more yellow and red (and less green) indicating that most years are much warmer than pre-1990.
- From the graph showing Correlation between carbon dioxide levels and temperature in the Ice Core, how long did it take for the previous global warming events to reach their peak?
- Tens of thousands of years.
- Did all the peaks take this long (tens of thousands of years) to increase the mean global temperature?
- Yes. All of the previous global warming events took many thousands of years.
- What was the date of the most recent values on our ice-core data? Was this value within the normal carbon dioxide range?
- 137 years before 1950. Normal range, 280 [ppmv].
- How quickly has the current average global temperature increased?
- 150 years (10 times faster).
✎STUDENT NOTES: Describe how temperatures have increased from the ‘normal range’ or average year temperature in the last hundred years, not over thousands of years.
Watch the video: Why reducing our carbon emissions matters (a little story about climate change) (3:32).
(Slide 55) Divide students into teams to research the impact of global warming. The depth of the research may vary depending on the time available. Areas they could research include changes in:
- the number of extreme heat days.
- rainfall patterns.
- number and severity of thunderstorms (including lightning that causes bushfires).
- the number and severity of drought, which makes the biomass more likely to burn easily.
Discuss the results of the students’ research and relate it to the impact on the number and severity of bushfires.
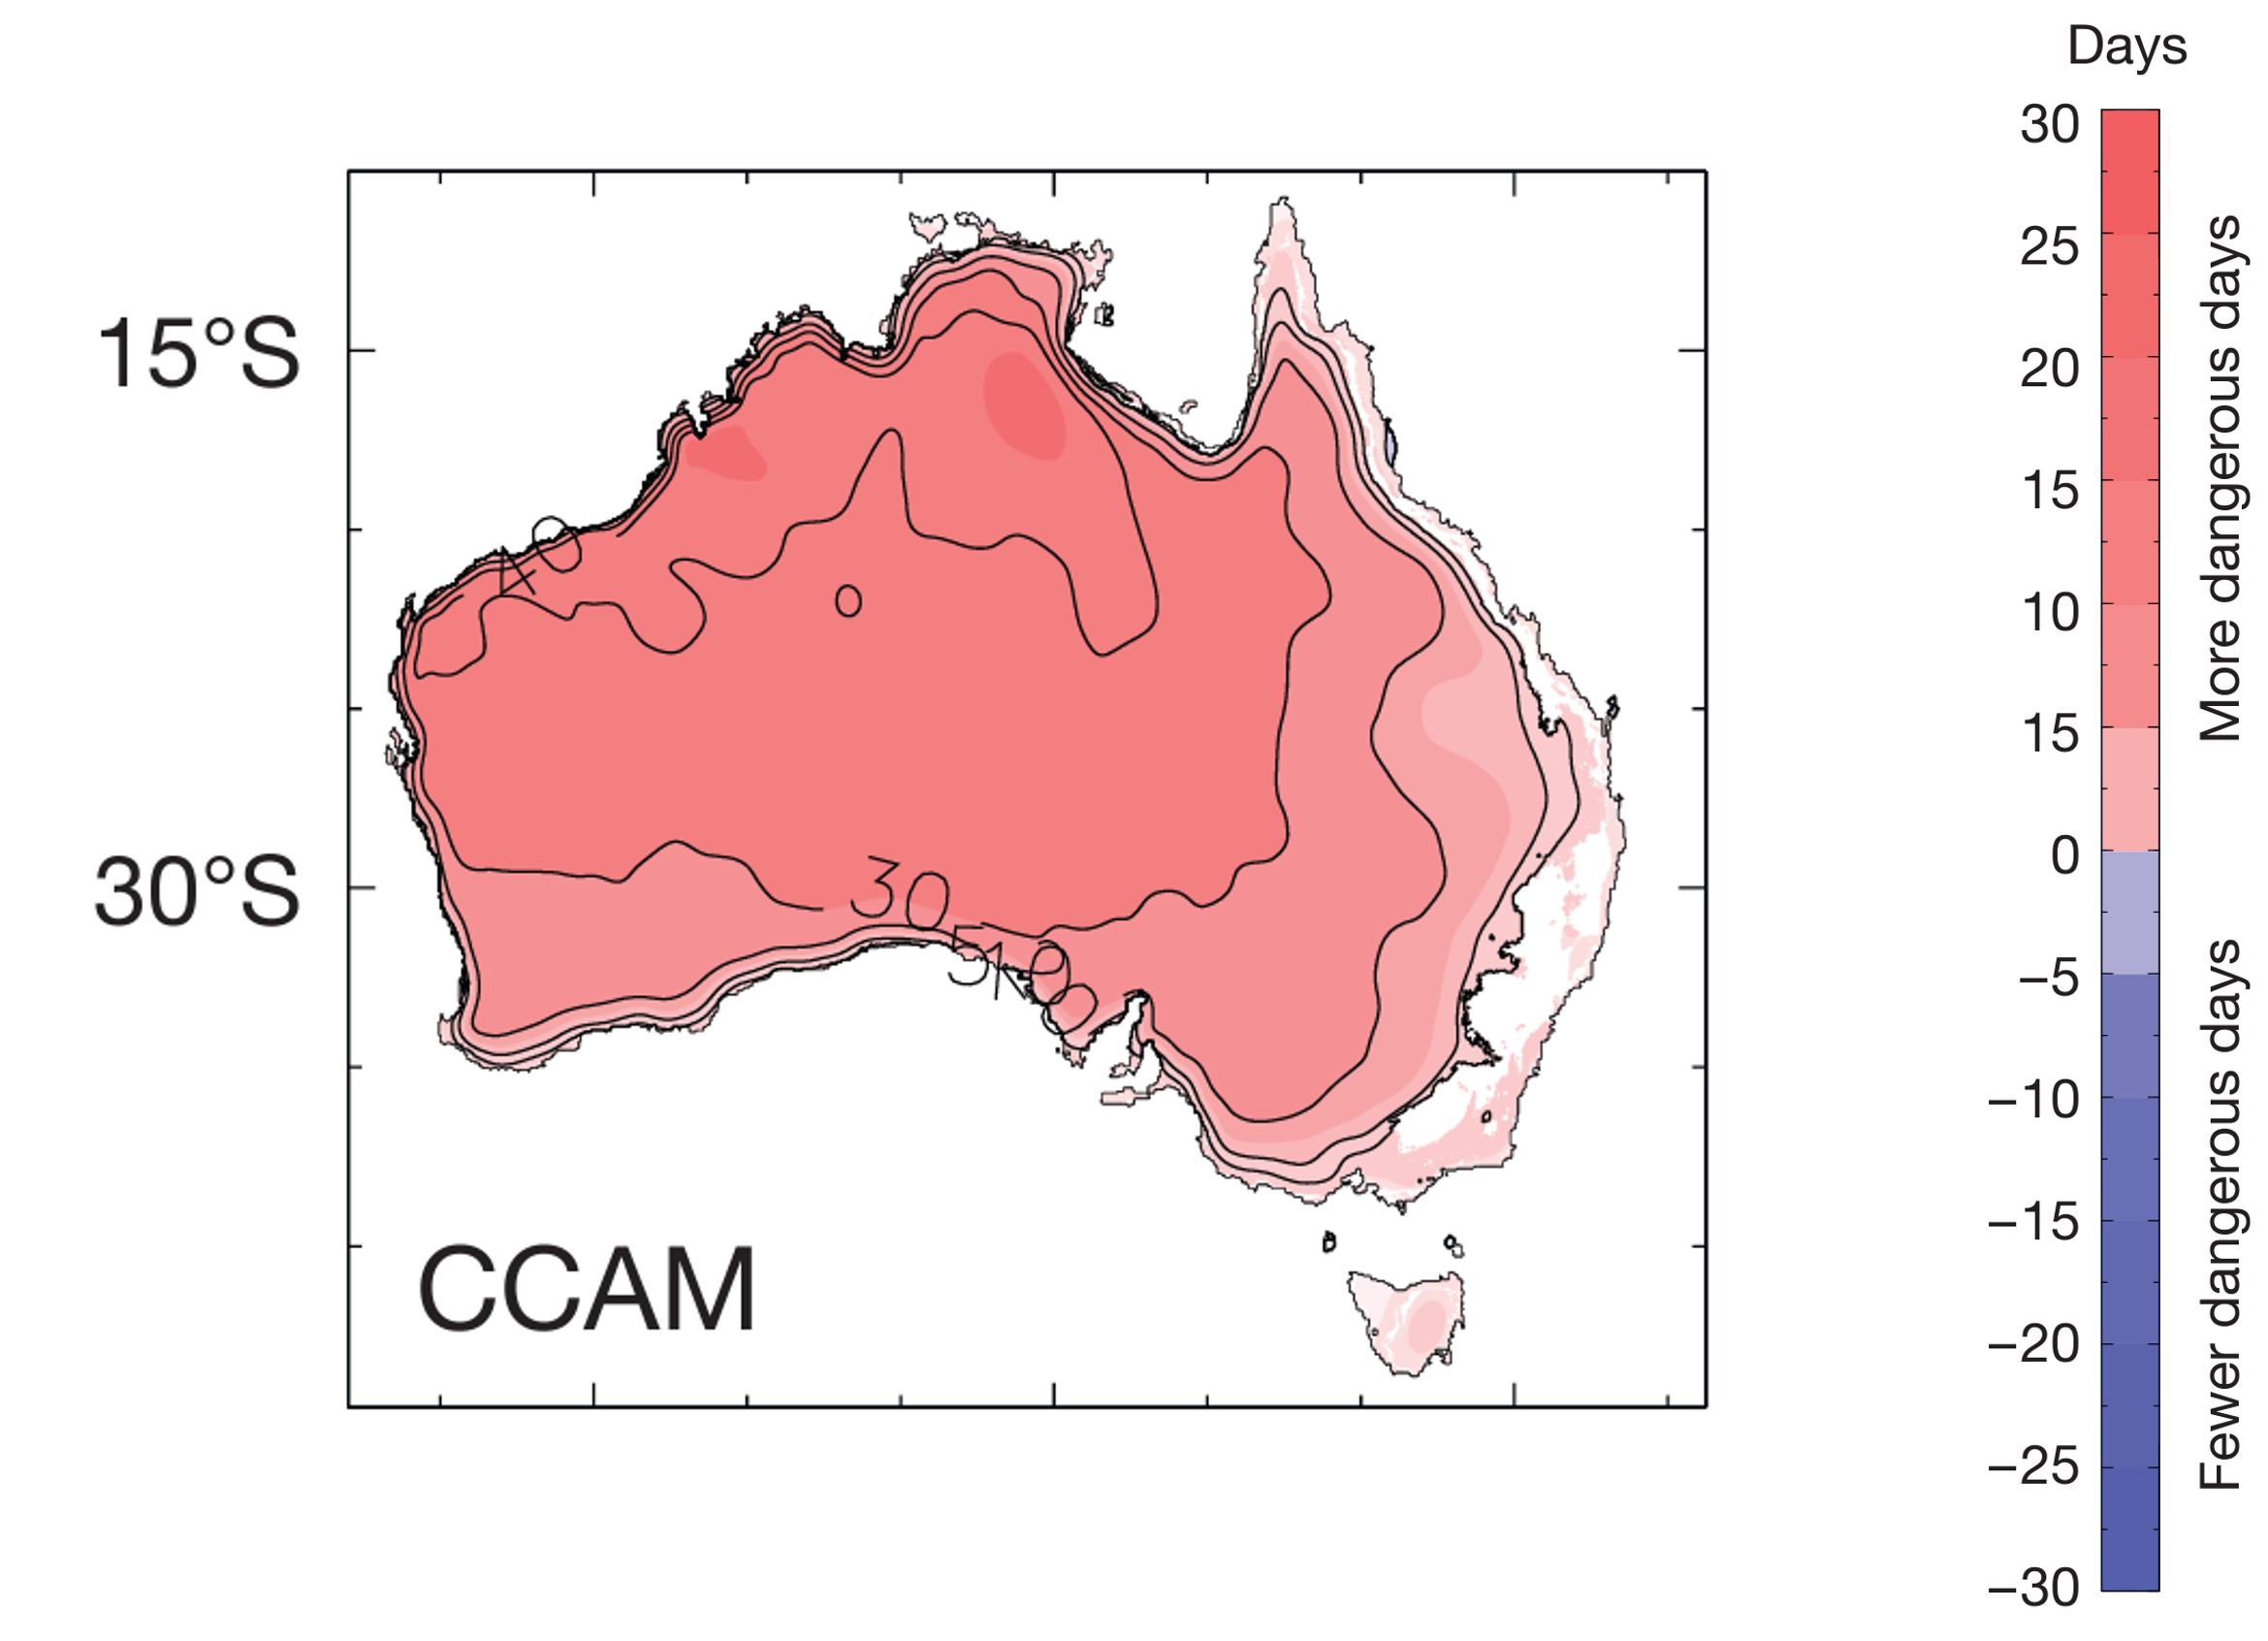
(Slide 56) Discuss how computer modelling can predict fire weather conditions in 2060 - showing increasing numbers of fire danger days.
✎STUDENT NOTES: Describe how computers can model trends in changing temperatures and the amount of fuel in an area that can indicate a greater risk of fires.
- What is a computer model?
- What data would need to be put into a computer model of bushfires?
- Temperature changes, fuel load in the area, number and severity of bushfires in the past, the type of fuel/plants in the area.
- How does the type and amount of data affect the effectiveness of a computer model?
- If there is not much data or variety of data, then the model is unreliable. The model needs to be tested over a number of years. This model has been tested and compared against other models.
- What colour shows nothing will change?
- Pale pink.
- What colour shows there will be a greater risk of fires?
- Dark red.
- Which area shows the greatest increased risk of fires in the future?
- North and north-west Australia.
Optional: Discuss how some scientists are currently working to reduce the amount of carbon dioxide being produced or remove it from the atmosphere. Discuss how this will be examined next lesson.
Reflect on this lesson
You might:
- use a carbon footprint calculator to determine the amount of carbon that you release into the atmosphere each year.
- re-examine the intended learning goals for the lesson and consider how they were achieved.
- discuss how students were thinking and working like scientists during the lesson. Focus on the ability to analyse models and determine any correlation or causation.