

Water mixture rescue
View Sequence overviewStudents will:
- prepare simple ink and paper chromatography.
- analyse the chromatography results to determine the most soluble substance.
- use their understanding of chromatography and solubility to determine the most soluble PFAS chemical in a mixture.
Students will represent their understanding as they:
- analyse the results of ink chromatography to identify the most soluble substance.
- identify anomalies in the chromatography results and suggest ways to increase the test’s reliability.
- identify the most soluble PFAS chemical and justify their decision.
In this lesson, assessment is formative.
Feedback might focus on students’ ability to:
- follow a chromatography method to achieve results.
- analyse the chromatography results.
- use solubility to explain chromatography results.
- transfer knowledge of solubility and chromatography to PFAS testing.
Potential summative assessment
Students working at standard should:
- re-examine data and evidence as new information about water contaminants become available.
- examine the features of reproducible investigations, constructing methods and reviewing other students’ methods.
- investigate and use a range of physical separation techniques such as chromatography.
- construct tables, spreadsheets and graphic organisers to collect data and information.
- use spreadsheets to aid the presentation and analysis of data.
Whole class
Water mixture rescue Slides
2 x 200 mL beakers of water
1 teaspoon of salt
1 teaspoon of flour
2 x teaspoons
Access to video clips of PFAS chemical regulation in drinking water, for example:
Each group
Water soluble marker or food dye (black or purple for chromatography)
Filter paper
200 mL beaker
Water
Lead pencil
Timer
Filter paper
Scissors
Paper clip or tape
Each student
Individual science notebook
Chromatography and solubility Resource sheet
PFAS levels Data resource
Lesson
The Inquire phase allows students to cycle progressively and with increasing complexity through the key science ideas related to the core concepts. Each Inquire cycle is divided into three teaching and learning routines that allow students to systematically build their knowledge and skills in science and incorporate this into their current understanding of the world.
When designing a teaching sequence, it is important to consider the knowledge and skills that students will need in the final Act phase. Consider what the students already know and identify the steps that need to be taken to reach the level required. How could you facilitate students’ understanding at each step? What investigations could be designed to build the skills at each step?
Read more about using the LIA FrameworkRe-orient
(Slide 67) Discuss how:
- magnetic properties were used to remove iron filings from the roof.
- size was used to filter large objects and prevented mosquitoes from breeding in the rainwater.
- a difference in the density of the particles in the mixture caused a sediment to form on the bottom of the tank through the sedimentation process.
- evaporation and crystallisation can be used to separate and measure the dissolved solids in a rainwater mixture.
Discuss how the appearance of the rainwater has changed since the Launch phase lesson.
If photos were taken following each separation technique, they could be used here to illustrate how the mixture has changed.
The Inquire phase allows students to cycle progressively and with increasing complexity through the key science ideas related to the core concepts. Each Inquire cycle is divided into three teaching and learning routines that allow students to systematically build their knowledge and skills in science and incorporate this into their current understanding of the world.
When designing a teaching sequence, it is important to consider the knowledge and skills that students will need in the final Act phase. Consider what the students already know and identify the steps that need to be taken to reach the level required. How could you facilitate students’ understanding at each step? What investigations could be designed to build the skills at each step?
Read more about using the LIA FrameworkIdentifying and constructing questions is the creative driver of the inquiry process. It allows students to explore what they know and how they know it. During the Inquire phase of the LIA Framework, the Question routine allows for past activities to be reviewed and to set the scene for the investigation that students will undertake. The use of effective questioning techniques can influence students’ view and interpretation of upcoming content, open them to exploration and link to their current interests and science capital.
When designing a teaching sequence, it is important to spend some time considering the mindset of students at the start of each Inquire phase. What do you want students to be thinking about, what do they already know and what is the best way for them to approach the task? What might tap into their curiosity?
Read more about using the LIA FrameworkIntroducing PFAS
Discuss how crystallisation only tested the amount of dissolved solids in the rainwater mixture, and not what type of solids they were.
Introduce the idea that some separation techniques are used for identifying particular particles in a mixture, for example, testing if the contaminant PFAS is in water.
Show New guidelines on PFAS in Australia’s drinking water (2:22).
(Slide 68) Explain that PFAS is a group of “forever chemicals” that do not break down in the environment. This means that the amount of PFAS chemicals in the environment will keep increasing if we keep using them. Many countries (including Australia from July 2025) have banned common PFAS chemicals and regularly measure the levels in the environment to ensure that they stay below the Australian guidelines.
✎ STUDENT NOTES: Write the definition of PFAS chemicals.
Pose the question: How are the PFAS levels in water tested?
PFAS chemicals
Per- and polyfluoroalkyl substances (PFAS) are a large group of human-made chemicals that have been in use since the 1940s.
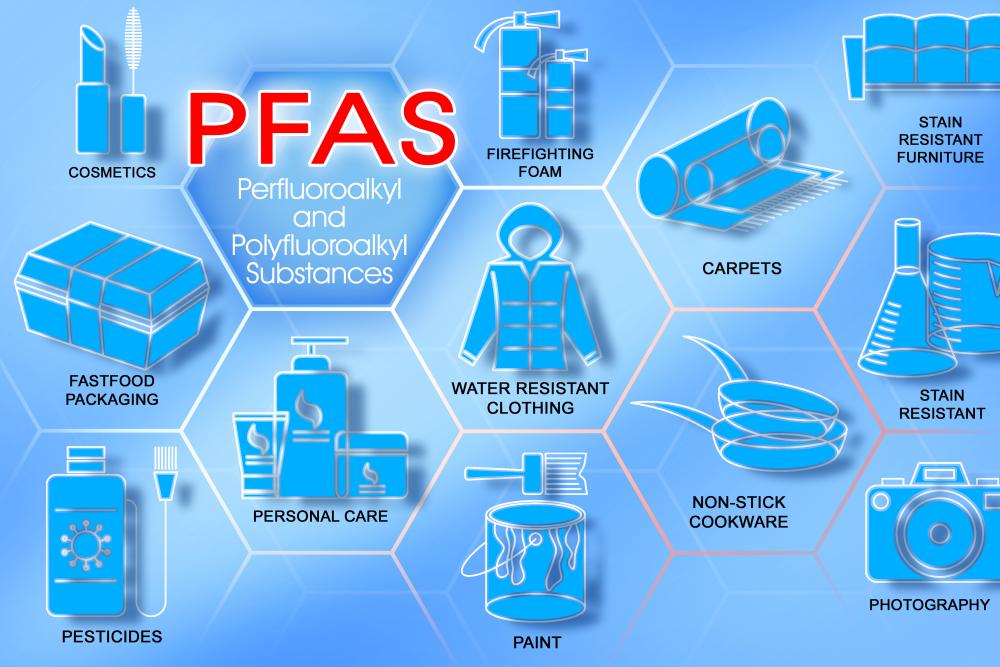
Per- and polyfluoroalkyl substances (PFAS) are a large group of human-made chemicals that have been in use since the 1940s. They are defined by extremely strong carbon-fluorine bonds, which are among the most stable in chemistry. This stability makes PFAS chemicals highly resistant to heat, water, and oil, leading to their widespread nickname as “forever chemicals” because they do not easily break down in the environment.
PFAS chemicals have been widely used in both industrial applications and everyday consumer products. Common examples include non-stick cookware, water-repellent clothing, grease-resistant food packaging, stain-resistant fabrics, and firefighting foams used at airports and military bases. Their unique properties have made them valuable in manufacturing, but these same properties contribute to long-term environmental problems.
One of the key concerns with PFAS chemicals is their persistence. Because they do not degrade easily, the PFAS chemicals can accumulate in soil, water, and living organisms over time. They are particularly mobile in water, allowing them to spread through groundwater and contaminate drinking water supplies far from their original source. As a result, PFAS chemical contamination has become a global issue.
Humans can be exposed to PFAS chemicals in several ways, including drinking contaminated water, consuming contaminated food such as fish, using products that contain PFAS chemicals, or through occupational exposure in certain industries. Studies have found PFAS chemicals in the blood of people worldwide, indicating that exposure is widespread and ongoing.
Research into the health effects of PFAS suggests potential links to a range of issues, including increased cholesterol levels, impacts on the immune system, hormonal disruption, developmental effects in infants and children, and an increased risk of certain cancers such as kidney and testicular cancer. However, the level of risk can vary depending on the type of PFAS chemical, the amount, and the duration of exposure.
In response to these concerns, governments around the world have begun regulating PFAS chemicals. Some of the most well-known compounds, such as PFOA and PFOS, have been phased out or restricted in many countries. In Australia, each state regularly tests for PFAS chemicals (including PFBS, PFOA, PFOS and PFHxS) and provides health-based guidance to reduce exposure risks.
References
Per- and poly-fluoroalkyl substances (PFASs) - DCCEEW. (2025, June 20). DCCEEW.gov.au. https://www.dcceew.gov.au/environment/protection/chemicals-management/pfas#what-are-pfass
Per- and polyfluoroalkyl substances (PFAS) are a large group of human-made chemicals that have been in use since the 1940s. They are defined by extremely strong carbon-fluorine bonds, which are among the most stable in chemistry. This stability makes PFAS chemicals highly resistant to heat, water, and oil, leading to their widespread nickname as “forever chemicals” because they do not easily break down in the environment.
PFAS chemicals have been widely used in both industrial applications and everyday consumer products. Common examples include non-stick cookware, water-repellent clothing, grease-resistant food packaging, stain-resistant fabrics, and firefighting foams used at airports and military bases. Their unique properties have made them valuable in manufacturing, but these same properties contribute to long-term environmental problems.
One of the key concerns with PFAS chemicals is their persistence. Because they do not degrade easily, the PFAS chemicals can accumulate in soil, water, and living organisms over time. They are particularly mobile in water, allowing them to spread through groundwater and contaminate drinking water supplies far from their original source. As a result, PFAS chemical contamination has become a global issue.
Humans can be exposed to PFAS chemicals in several ways, including drinking contaminated water, consuming contaminated food such as fish, using products that contain PFAS chemicals, or through occupational exposure in certain industries. Studies have found PFAS chemicals in the blood of people worldwide, indicating that exposure is widespread and ongoing.
Research into the health effects of PFAS suggests potential links to a range of issues, including increased cholesterol levels, impacts on the immune system, hormonal disruption, developmental effects in infants and children, and an increased risk of certain cancers such as kidney and testicular cancer. However, the level of risk can vary depending on the type of PFAS chemical, the amount, and the duration of exposure.
In response to these concerns, governments around the world have begun regulating PFAS chemicals. Some of the most well-known compounds, such as PFOA and PFOS, have been phased out or restricted in many countries. In Australia, each state regularly tests for PFAS chemicals (including PFBS, PFOA, PFOS and PFHxS) and provides health-based guidance to reduce exposure risks.
References
Per- and poly-fluoroalkyl substances (PFASs) - DCCEEW. (2025, June 20). DCCEEW.gov.au. https://www.dcceew.gov.au/environment/protection/chemicals-management/pfas#what-are-pfass
The Inquire phase allows students to cycle progressively and with increasing complexity through the key science ideas related to the core concepts. Each Inquire cycle is divided into three teaching and learning routines that allow students to systematically build their knowledge and skills in science and incorporate this into their current understanding of the world.
When designing a teaching sequence, it is important to consider the knowledge and skills that students will need in the final Act phase. Consider what the students already know and identify the steps that need to be taken to reach the level required. How could you facilitate students’ understanding at each step? What investigations could be designed to build the skills at each step?
Read more about using the LIA FrameworkThe Investigate routine provides students with an opportunity to explore the key ideas of science, to plan and conduct an investigation, and to gather and record data. The investigations are designed to systematically develop content knowledge and skills through increasingly complex processes of structured inquiry, guided inquiry and open inquiry approaches. Students are encouraged to process data to identify trends and patterns and link them to the real-world context of the teaching sequence.
When designing a teaching sequence, consider the diagnostic assessment (Launch phase) that identified the alternative conceptions that students held. Are there activities that challenge these ideas and provide openings for discussion? What content knowledge and skills do students need to be able to complete the final (Act phase) task? How could you systematically build these through the investigation routines? Are there opportunities to build students’ understanding and skills in the science inquiry processes through the successive investigations?
Read more about using the LIA FrameworkChromatography and solubility
(Slides 69-70) Explain that chromatography is a way to separate mixtures based on the property of solubility. Define “solubility” as how easily a substance (salt) dissolves in a larger substance (water).
✎ STUDENT NOTES: Write the definition of solubility.
Demonstrate solubility by comparing how quickly a teaspoon of salt dissolves in water to how quickly a teaspoon of flour dissolves in water.
- What did you notice about how the salt and flour behaved in the water?
- Which substance seemed to “disappear” faster? Why do you think that is?
- Did the salt actually disappear? Why do you think that?
- Did either mixture look cloudy or clear/transparent? What does that tell you?
- What does it mean for something to dissolve?
- Why do you think salt dissolves in water, but flour does not dissolve in the same way?
- Is the flour actually dissolving? How can you tell?
- What do you think is happening to the salt particles in the water? Are they still there?
- Which substance (salt or flour) is most soluble in water?
Explain that students can use solubility in a simple chromatography test to find out what is in the ink of a water-soluble marker.
(Slide 71) Explain or demonstrate to students how to set up the chromatography test. Explain that the ink in the marker contains a number of different substances with different solubilities. Some inks dissolve quickly in water, while other substances take longer to dissolve.
- Cut a strip of chromatography paper so it will hang inside the beaker without touching the sides.
- Use the lead pencil to draw a line about 2 cm from the bottom of the paper. Draw another line 3 cm above the first line.
- Use the marker or food dye to be tested to make a 0.5 cm circle on the bottom pencil line. Let it dry, then add another layer on the same spot to make it stronger.
- Pour water in the beaker such that it reaches a height of 1 cm (the water level must be below the marker spot).
- Attach the paper to a pencil or paper clip and suspend it in the beaker so the bottom of the paper touches the water, but the ink spot stays above the waterline.
- Start the timer and leave the paper to sit, allowing the water to slowly rise up the paper.
- When the water almost reaches the top pencil line, record the time.
- As each colour reaches the top pencil line, record the time.
Provide students with a copy of the Chromatography and solubility Resource sheet.
(Slide 72) Emphasise that students will be measuring the time it takes for each colour to reach the top pencil line. Discuss if the time will be recorded when the colour first reaches the pencil line, when the middle crosses or when the colour leaves the pencil line. Link this decision to the test being reliable and reproducible (similar to the testing for the presence of PFAS).
Allow students time to complete the Chromatography and solubility Resource sheet.
Dissolving and solubility
Solubility is the ability of a substance (the solute) to dissolve in a liquid (the solvent) to form a solution.
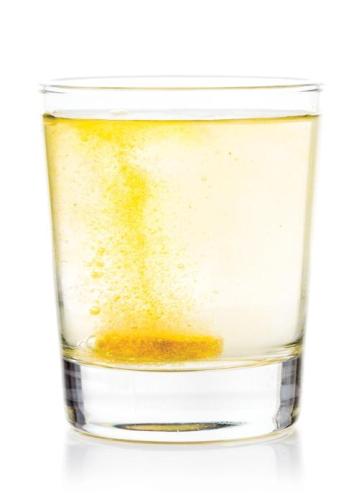
Solubility is the ability of a substance (the solute) to dissolve in a liquid (the solvent) to form a solution. When a soluble solid, such as salt or sugar, is added to water, its particles spread out evenly throughout the liquid and become invisible. This forms a clear solution. Importantly, the substance does not change into something new—it is still the same material, just evenly mixed at a particle level.
Not all substances are soluble in water. Whether something dissolves depends on its solubility and the type of liquid it is placed in. For example, salt dissolves well in water, but substances like fats or oils do not. Some materials that do not dissolve in water may dissolve in other liquids. For instance, nail polish does not dissolve in water but will dissolve in acetone. This shows that solubility depends on the physical properties of both the solute and the solvent.
When a substance does not dissolve, it may form a suspension instead. In this case, small solid particles are spread through the liquid but not fully broken apart. This can make the liquid look cloudy. Over time, these particles may settle at the bottom. Even soluble substances may briefly make a liquid look cloudy when first added, because dissolving takes time. Stirring helps increase the rate of dissolving by bringing more solvent into contact with the solute.
There is a limit to how much of a substance can dissolve in a liquid. When no more solute can dissolve, the solution is called saturated. Any extra solid added after this point will remain undissolved. The amount that can dissolve can change with conditions. For many solids, increasing the temperature allows more to dissolve. For example, hot water can dissolve more sugar than cold water. If a hot saturated solution cools down, some of the dissolved substance may precipitate out of the solution as crystals.
Solubility also applies to gases. Gases can dissolve in liquids, as seen in carbonated drinks, where carbon dioxide gas is dissolved in water under pressure. When the pressure is released by opening the container, the gas escapes as bubbles.
Solubility is the ability of a substance (the solute) to dissolve in a liquid (the solvent) to form a solution. When a soluble solid, such as salt or sugar, is added to water, its particles spread out evenly throughout the liquid and become invisible. This forms a clear solution. Importantly, the substance does not change into something new—it is still the same material, just evenly mixed at a particle level.
Not all substances are soluble in water. Whether something dissolves depends on its solubility and the type of liquid it is placed in. For example, salt dissolves well in water, but substances like fats or oils do not. Some materials that do not dissolve in water may dissolve in other liquids. For instance, nail polish does not dissolve in water but will dissolve in acetone. This shows that solubility depends on the physical properties of both the solute and the solvent.
When a substance does not dissolve, it may form a suspension instead. In this case, small solid particles are spread through the liquid but not fully broken apart. This can make the liquid look cloudy. Over time, these particles may settle at the bottom. Even soluble substances may briefly make a liquid look cloudy when first added, because dissolving takes time. Stirring helps increase the rate of dissolving by bringing more solvent into contact with the solute.
There is a limit to how much of a substance can dissolve in a liquid. When no more solute can dissolve, the solution is called saturated. Any extra solid added after this point will remain undissolved. The amount that can dissolve can change with conditions. For many solids, increasing the temperature allows more to dissolve. For example, hot water can dissolve more sugar than cold water. If a hot saturated solution cools down, some of the dissolved substance may precipitate out of the solution as crystals.
Solubility also applies to gases. Gases can dissolve in liquids, as seen in carbonated drinks, where carbon dioxide gas is dissolved in water under pressure. When the pressure is released by opening the container, the gas escapes as bubbles.
The Inquire phase allows students to cycle progressively and with increasing complexity through the key science ideas related to the core concepts. Each Inquire cycle is divided into three teaching and learning routines that allow students to systematically build their knowledge and skills in science and incorporate this into their current understanding of the world.
When designing a teaching sequence, it is important to consider the knowledge and skills that students will need in the final Act phase. Consider what the students already know and identify the steps that need to be taken to reach the level required. How could you facilitate students’ understanding at each step? What investigations could be designed to build the skills at each step?
Read more about using the LIA FrameworkFollowing an investigation, the Integrate routine provides time and space for data to be evaluated and insights to be synthesized. It reveals new insights, consolidates and refines representations, generalises context and broadens students’ perspectives. It allows student thinking to become visible and opens formative feedback opportunities. It may also lead to further questions being asked, allowing the Inquire phase to start again.
When designing a teaching sequence, consider the diagnostic assessment that was undertaken during the Launch phase. Consider if alternative conceptions could be used as a jumping off point to discussions. How could students represent their learning in a way that would support formative feedback opportunities? Could small summative assessment occur at different stages in the teaching sequence?
Read more about using the LIA FrameworkPFAS levels
✎ STUDENT NOTES: Stick the completed chromatography paper into the science notebook. Complete the questions on the Chromatography and solubility Resource sheet.
(Slides 73-74) Compare the results of the experiment, including the times recorded for each colour. Discuss how one of the colours would have dissolved first and started moving up the paper quickly. Less soluble colours take more time to dissolve and are slower to move. Encourage students to identify which colour was most soluble and which was least soluble.
- What did you notice happening to the ink or dye as the water moved up the paper?
- What colours did you see separate from the original dot?
- Why do you think the ink separates into different colours?
- What role does the water play in this experiment?
- Why do some colours move faster up the paper than others?
- What does this tell you about how soluble each colour is in water?
- What do you think would happen if we used a different solvent (e.g. salt water or alcohol)?
- Where might chromatography be used outside the classroom (e.g. forensic science, food testing)?
Discuss any possible explanations for anomalies in measurement, including water being at different temperatures, the amount of each marker used, and where in the dot the time was recorded. Discuss how the method could be improved (made more reliable) to prevent these errors in the future, including making sure the lines are horizontal, the paper is of even thickness, the size of the dot is consistent, etc.
✎ STUDENT NOTES: Write two ways that the reliability of the chromatography activity could be improved.
(Slide 75) Explain to students that the process of chromatography is used to separate and identify the different types of PFAS chemicals.
Optional: Provide students with a copy of the PFAS levels Data resource. Use the tab labelled PFAS chromatography.
Pose the question: Which PFAS chemical was the most soluble?
Discuss how PFBS is the most soluble as it took the least time (7.62 minutes) to move to the detector. PFOS is the least soluble as it took the most time (17.91 minutes) to reach the detector.
✎ STUDENT NOTES: Identify which PFAS chemical is most soluble. Justify your answer.
Optional: Show students the table and graph on the tab labelled Full data PFAS chromatography in the PFAS levels Data resource. Discuss the x-axis (time), showing how long it took for each type of PFAS to reach and move through the HPLC detector.
Note: The times shown in the Full data PFAS chromatography tab varies from the data on the PFAS chromatography tab as the tests were completed by different scientific groups using different HPLC machines with different flow rates.
Explain that an advanced form of chromatography (high-performance liquid chromatography with mass spectrometry) is used to regularly test the levels of PFAS in each state’s water.
(Slide 76) Provide students a copy of the PFAS levels Data resource. Identify the values measured in the water supplies in each state. Compare these to the Australian guideline PFAS levels. Explain to students that 1 nanogram is equivalent to 1 drop in 20 Olympic-sized swimming pools.
Discuss if the measured PFAS levels in the local state are above or below the recommended guidelines.
Optional: Use the links on each tab of the spreadsheet to research the most recent PFAS values measured in each state.
✎ STUDENT NOTES: Record the most recent levels of PFAS found in state waters and if they are above or below the recommended Australian guideline values.
Remind students that PFAS chemicals are used in firefighting foams, stain-resistant carpets, and food packaging. Discuss how it would be unlikely for PFAS to be found in water stored in a tank.
- What products commonly contain PFAS?
- Firefighting foams, stain-resistant carpets, food packaging.
- How can PFAS from these products enter the environment?
- Why is it unlikely for PFAS to be present in water stored in a clean tank?
- What conditions would need to occur for PFAS to contaminate rainwater?
- Why is testing for PFAS more important in some locations than others?
- What actions could be taken to reduce the risk of PFAS entering water supplies?
Explain that students will not use chromatography to test their water samples for PFAS chemicals, as it is unlikely that PFAS will be found (especially in such small amounts).
Reflect on the lesson
You might ask students to:
- add new words (solubility, chromatography, PFAS) to their glossary.
- research why the Australian government is regulating the amount of PFAS chemicals in the environment.
- describe the ways in which they worked like scientists during the lesson.
- research how HPLC works.
High-performance liquid chromatography
High-performance liquid chromatography (HPLC) is an advanced analytical technique.
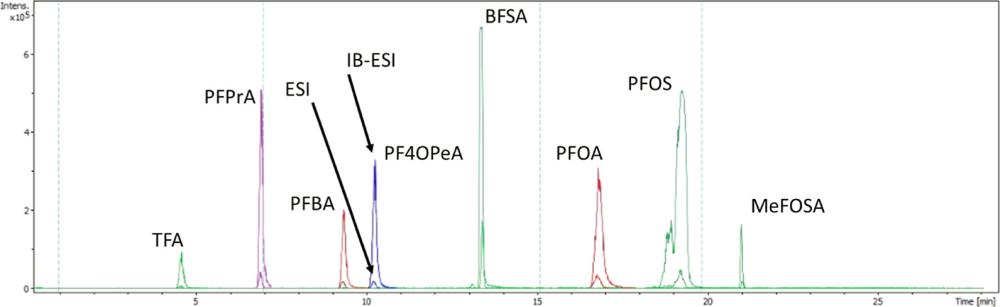
High-performance liquid chromatography (HPLC) is an extension of simpler chromatography techniques (such as paper chromatography), but with greater control, speed and accuracy. It is used to separate, identify and quantify components within a liquid mixture. It is widely used in fields such as environmental testing, pharmaceuticals and food analysis.
In HPLC, a liquid solvent continuously flows through a column. Similar to the paper in this chromatography experiment, the column slows down the movement of different substances depending on their properties. If a mixture is injected into the liquid solvent, some components move quickly, while others are slowed down. This is due to their chemical properties (such as charges, polarity, or size). This process is known as differential migration and is what enables the separation.
As the different components exit the column, they pass through a detector. The output of the detector is a graph called a chromatogram. Each substance appears as a peak at different times on the chromatogram:
- The retention time (when the peak appears) helps identify the substance by comparison to known standards.
- The peak area (size of the peak) is proportional to the amount of that substance present in the sample.
Common chromatography misconceptions include:
- thinking substances “disappear” rather than separate.
- confusing retention time with quantity.
- assuming all components travel at the same speed.
High-performance liquid chromatography (HPLC) is an extension of simpler chromatography techniques (such as paper chromatography), but with greater control, speed and accuracy. It is used to separate, identify and quantify components within a liquid mixture. It is widely used in fields such as environmental testing, pharmaceuticals and food analysis.
In HPLC, a liquid solvent continuously flows through a column. Similar to the paper in this chromatography experiment, the column slows down the movement of different substances depending on their properties. If a mixture is injected into the liquid solvent, some components move quickly, while others are slowed down. This is due to their chemical properties (such as charges, polarity, or size). This process is known as differential migration and is what enables the separation.
As the different components exit the column, they pass through a detector. The output of the detector is a graph called a chromatogram. Each substance appears as a peak at different times on the chromatogram:
- The retention time (when the peak appears) helps identify the substance by comparison to known standards.
- The peak area (size of the peak) is proportional to the amount of that substance present in the sample.
Common chromatography misconceptions include:
- thinking substances “disappear” rather than separate.
- confusing retention time with quantity.
- assuming all components travel at the same speed.
2019 PFAS levels in the North Esk River
In 2019, the Tasmanian Department of Health tested the water and fish in the North Esk River.
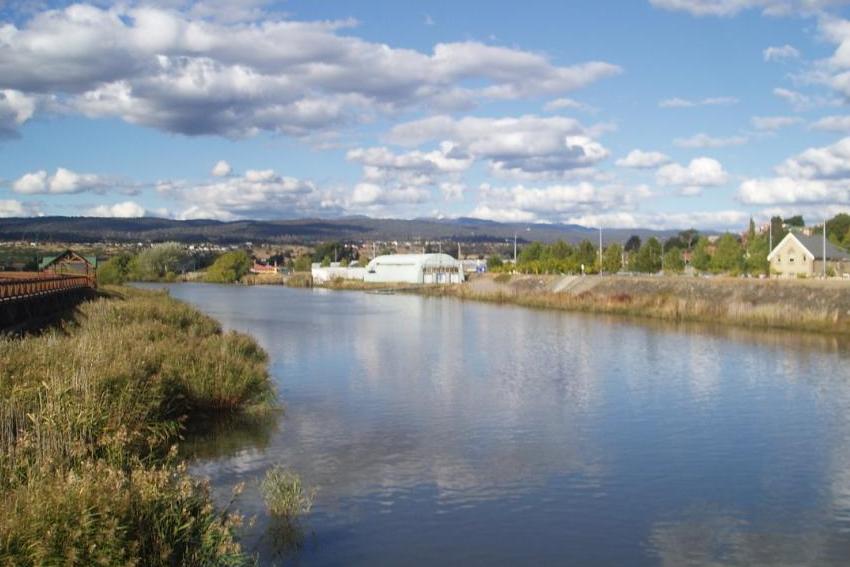
In 2019, the Tasmanian Department of Health tested the water and fish in the North Esk River. While the PFAS levels in the water were lower than the government regulations at the time, the levels of PFAS in the fish were significantly higher suggestion bioaccumulation of PFAS. As a result, the Department of Health issued advice to the public not to eat any fish caught in the North Esk River, from Corra Linn Gorge to the Tamar River.
References
Per- and poly-fluoroalkyl substances (PFAS). (2025, July 8). Tasmanian Department of Health. https://www.health.tas.gov.au/health-topics/environmental-health/and-poly-fluoroalkyl-substances-pfas#north-esk-river
In 2019, the Tasmanian Department of Health tested the water and fish in the North Esk River. While the PFAS levels in the water were lower than the government regulations at the time, the levels of PFAS in the fish were significantly higher suggestion bioaccumulation of PFAS. As a result, the Department of Health issued advice to the public not to eat any fish caught in the North Esk River, from Corra Linn Gorge to the Tamar River.
References
Per- and poly-fluoroalkyl substances (PFAS). (2025, July 8). Tasmanian Department of Health. https://www.health.tas.gov.au/health-topics/environmental-health/and-poly-fluoroalkyl-substances-pfas#north-esk-river