Ecosystems beyond Earth
View Sequence overviewStudents will:
- identify that the portion of a plant that is edible will vary between plants.
- use percentages to compare the portion of plants that are edible.
- use secondary data to explore the recycling of matter in the ISS environment.
- use argumentation skills to make a claim supported by evidence and reasoning.
Students will represent their understanding as they:
- use secondary data to generate a graph.
- use secondary data to identify plants that would be suitable to grow on the ISS.
- use argumentation skills to justify their decisions.
In this lesson, assessment may be formative.
Feedback might focus on:
- understanding of the recyclability of matter in an ecosystem.
- the ability to use software to organise data.
- the ability to assess the reliability of second-hand data.
- the ability to use evidence and reasoning to support a claim.
Potential summative assessment
Students working at the achievement standard should:
- represent flows of matter in ecosystems.
- identify considerations for the use of secondary data.
- select and construct appropriate representations to organise data and information.
- use spreadsheets to aid the presentation and analysis of data.
- process data and information and analyse to describe patterns, trends and relationships.
- identify evidence to support their conclusions and construct arguments to support or dispute claims.
Refer to the Australian Curriculum content links on the Our design decisions tab for further information.
Whole class
Ecosystems beyond Earth Resource PowerPoint
Edible plant (lettuce seedling) with roots, from the previous lesson—as a demonstration or for use in individual teams
Cutting board
Knife
Scales
Each group
Edible plant Data resource
Access to spreadsheet software (i.e.Excel)
Each student
Individual notebook
Selecting plants Resource sheet
Lesson
The Inquire phase allows students to cycle progressively and with increasing complexity through the key science ideas related to the core concepts. Each Inquire cycle is divided into three teaching and learning routines that allow students to systematically build their knowledge and skills in science and incorporate this into their current understanding of the world.
When designing a teaching sequence, it is important to consider the knowledge and skills that students will need in the final Act phase. Consider what the students already know and identify the steps that need to be taken to reach the level required. How could you facilitate students’ understanding at each step? What investigations could be designed to build the skills at each step?
Read more about using the LIA FrameworkRe-orient
Allow students time to make observations and measurements of their plants.
Discuss any differences that are observed, focusing on any biases that students may have towards the effect of a particular colour of light.
Recall the different ways that plants can grow, including number of leaves, thickness/length/width of leaves, and the height of the plant.
The Inquire phase allows students to cycle progressively and with increasing complexity through the key science ideas related to the core concepts. Each Inquire cycle is divided into three teaching and learning routines that allow students to systematically build their knowledge and skills in science and incorporate this into their current understanding of the world.
When designing a teaching sequence, it is important to consider the knowledge and skills that students will need in the final Act phase. Consider what the students already know and identify the steps that need to be taken to reach the level required. How could you facilitate students’ understanding at each step? What investigations could be designed to build the skills at each step?
Read more about using the LIA FrameworkIdentifying and constructing questions is the creative driver of the inquiry process. It allows students to explore what they know and how they know it. During the Inquire phase of the LIA Framework, the Question routine allows for past activities to be reviewed and to set the scene for the investigation that students will undertake. The use of effective questioning techniques can influence students’ view and interpretation of upcoming content, open them to exploration and link to their current interests and science capital.
When designing a teaching sequence, it is important to spend some time considering the mindset of students at the start of each Inquire phase. What do you want students to be thinking about, what do they already know and what is the best way for them to approach the task? What might tap into their curiosity?
Read more about using the LIA FrameworkWhat is edible?
Discuss the type of growth that is needed (many leaves with crispness) and the limitations of plant growth (height and plant waste) on the ISS.
- How much food needs to be grown on the ISS?
- How many different foods do you think they will need to grow to meet the nutrition needs of the astronauts?
- How big are the growing areas on the ISS? Will this affect the types of plants that can be grown?
- How much of a plant can be eaten?
- What happens to the rest of the plant?
✎ STUDENT NOTES: Brainstorm the criteria for selecting a plant to test on the ISS. This will be used later in the lesson.
Pose the question: How much of a plant is edible? How much of a plant needs to be recycled?
The Inquire phase allows students to cycle progressively and with increasing complexity through the key science ideas related to the core concepts. Each Inquire cycle is divided into three teaching and learning routines that allow students to systematically build their knowledge and skills in science and incorporate this into their current understanding of the world.
When designing a teaching sequence, it is important to consider the knowledge and skills that students will need in the final Act phase. Consider what the students already know and identify the steps that need to be taken to reach the level required. How could you facilitate students’ understanding at each step? What investigations could be designed to build the skills at each step?
Read more about using the LIA FrameworkThe Investigate routine provides students with an opportunity to explore the key ideas of science, to plan and conduct an investigation, and to gather and record data. The investigations are designed to systematically develop content knowledge and skills through increasingly complex processes of structured inquiry, guided inquiry and open inquiry approaches. Students are encouraged to process data to identify trends and patterns and link them to the real-world context of the teaching sequence.
When designing a teaching sequence, consider the diagnostic assessment (Launch phase) that identified the alternative conceptions that students held. Are there activities that challenge these ideas and provide openings for discussion? What content knowledge and skills do students need to be able to complete the final (Act phase) task? How could you systematically build these through the investigation routines? Are there opportunities to build students’ understanding and skills in the science inquiry processes through the successive investigations?
Read more about using the LIA FrameworkWaste not want not
(Slide 15) Show students an edible plant (with roots) obtained from the local area.
Discuss the different parts of the plant, what parts are edible, and what parts cannot be eaten (are waste matter).
✎ STUDENT NOTES: Note the edible parts of the plant on the diagram drawn in the previous lesson.
As a demonstration, or in individual teams, wash the soil from the roots of the plant and separate the edible portion from the non-edible waste matter.
(Slide 16) Discuss how these two portions could be measured and compared.
- How could we measure how much is in each portion?
- By weighing each portion.
- What would normally happen to the non-edible/waste matter portion here on Earth?
- It is usually composted into soil that can be reused to grow more plants.
- Is that possible on the ISS? Why or why not?
- Not currently. Some portions are wasted.
- What happens to waste on the ISS?
- All waste matter is packed into a small container and is released to burn up on re-entry to the Earth’s atmosphere. This means we cannot reuse/recycle the waste matter.
- How would this be different on the Moon or Mars? Could we recycle the waste there?
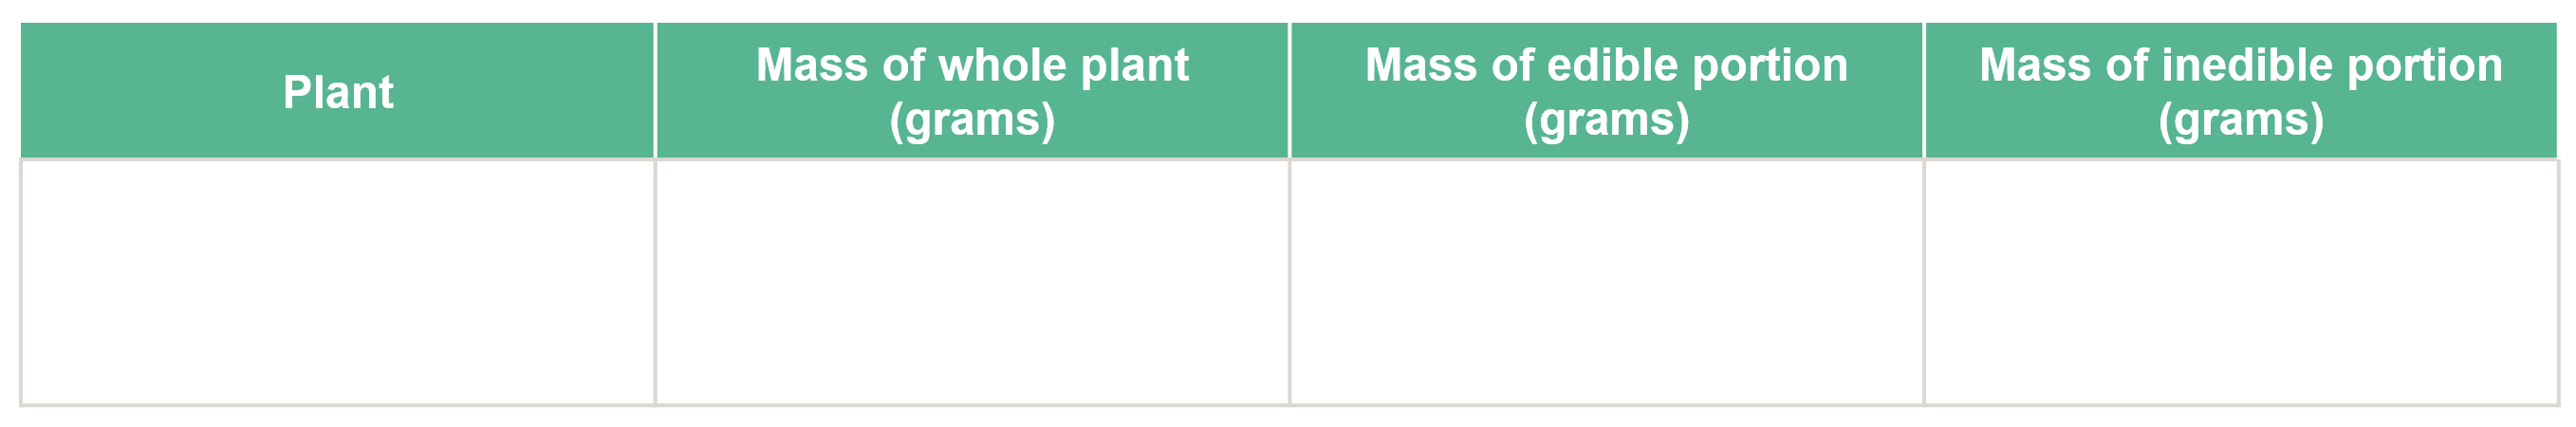
(Slide 17) Use scales to measure the mass of the whole plant, the edible portion, and the inedible portion.
Discuss the lack of decomposers (fungi and bacteria) and worms that might help with the breakdown of the inedible portions into compost.
✎ STUDENT NOTES: Draw a table to record the results of the measurement.
Discuss if this plant would be worth growing on the ISS. Refer back to the brainstorm of criteria of plants to test on the ISS.
(Slide 18) Compare the plant to the proportions of spinach—60g edible and 40g inedible. Discuss how difficult it is to compare the mass.
- Does more of the plant’s energy go into growing the edible portion, or the inedible portion? Which has the greatest mass?
- How could we compare the edible proportions of big plants to small plants?
- What does percentage mean?
- Which is larger, 5 grams or 10 grams?
- Which is a bigger proportion, 10% or 15%?
- Which is a bigger proportion, half (50%) of a big plant or half (50%) of a small plant?
- They are both the same proportion (50%).
- If one plant is 40% edible, and another plant is 50% edible, which plant has the greatest proportion that is edible?
Divide groups of students according to their abilities and select the appropriate data tabs from the Edible plant Data resource. Discuss how tables are a good way to organise data, and that graphs are a way to visually use data to tell a ‘story’.
There are four sets of data provided as part of this activity.
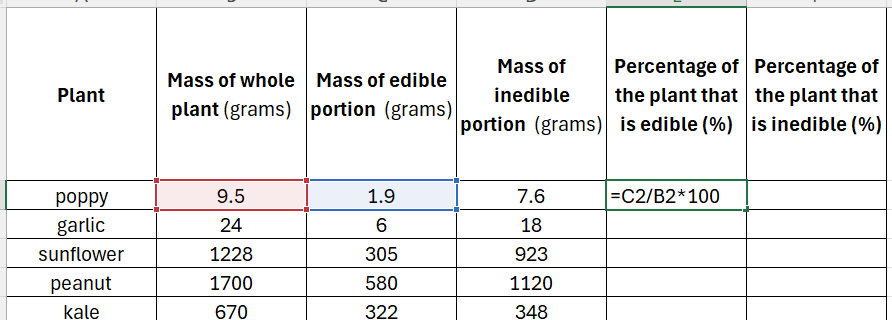
Data 1: The original dataset containing the mass of edible and inedible proportions. Students need to convert this data into percentages before generating a column graph of the data.
Data 2: The original dataset with the percentages already calculated. Students use this data to generate a column graph for comparison of edible proportions.
Data 3: A simplified dataset containing just the plants and their proportions. Students use this data to generate a column graph for comparison of edible proportions.
Data 4: The simplified dataset with the column graph already inserted for students who have a limited ability to use a computer or spreadsheet.
(Slide 19) Guide students through the process of:
- Calculating the percentage values for edible and inedible proportions.
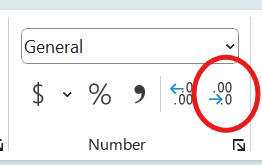
Reducing the number of decimal places—on the Home tab, in the Number group, select ‘Decrease decimal’.
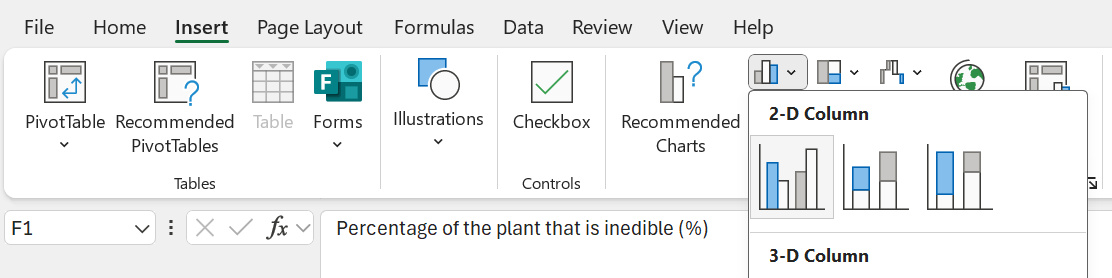
- Select the data to be graphed (plant, percentage edible, percentage inedible) by holding down the CTRL key and selecting the data in those three columns.
In the Insert tab, select ‘Column graph’ in the Charts group.
- Select the chart, then select the Chart Design tab.
- Select ‘Add Chart Element’ from the LHS of the top ribbon to add a title for the graph and axis labels.
- The completed graph can be printed or copied and pasted into STUDENT NOTES.
Ecosystem’s matter
Matter cannot be created or destroyed.

Matter cannot be created or destroyed. Instead, it moves through an ecosystem in a cyclic manner, meaning it is continuously recycled and reused. Unlike energy, which flows in one direction, matter is conserved and reused by organisms in different forms.
- Producers (plants, algae, etc.) convert inorganic matter (like CO₂, water, and minerals) into organic matter (like glucose) through photosynthesis.
- Consumers (herbivores, carnivores) take in organic matter (plants or other organisms) and break it down for energy.
- Decomposers break down dead organic matter, returning nutrients to the soil and atmosphere, where they can be reused by producers.
The movement of matter through an ecosystem also involves several biogeochemical cycles, where elements like carbon, nitrogen, oxygen, and phosphorus move between the living and non-living components of the environment.
Percentage mathematics
A percentage is a proportion of an amount expressed as a fraction of 100.
A percentage is a proportion of an amount expressed as a fraction of 100. In this example, it is a way of comparing what proportion of large and small plants are edible or inedible. In this way, 40% of a big plant is a lesser proportion than 50% of a smaller plant despite it having a greater mass. The edible and inedible proportion will add up to the full 100%.
It is important that students have an understanding of proportional reasoning. While most students will have started calculating percentages in previous years, this activity requires students to understand the concept of proportion that underpins the percent value.
Differentiation
Differentiation involves modifying the content, process or product.

Students come to the classroom with a variety of digital skills and capabilities. How teachers address these differences is called differentiation.
There are multiple ways to tailor the learning for students, including:
- modifying the content—the teacher makes changes to the amount of content or the way it is presented to the student.
- modifying the process—the teacher makes changes to a specific activity, so the learning of the content is attainable.
- modify the product—the teacher makes changes to the criteria or level of mastery that is required of the student.
In this activity, different sets of data are provided so that the teacher is able to modify the process, enabling students to develop a full understanding of the content involved.
The Inquire phase allows students to cycle progressively and with increasing complexity through the key science ideas related to the core concepts. Each Inquire cycle is divided into three teaching and learning routines that allow students to systematically build their knowledge and skills in science and incorporate this into their current understanding of the world.
When designing a teaching sequence, it is important to consider the knowledge and skills that students will need in the final Act phase. Consider what the students already know and identify the steps that need to be taken to reach the level required. How could you facilitate students’ understanding at each step? What investigations could be designed to build the skills at each step?
Read more about using the LIA FrameworkFollowing an investigation, the Integrate routine provides time and space for data to be evaluated and insights to be synthesized. It reveals new insights, consolidates and refines representations, generalises context and broadens students’ perspectives. It allows student thinking to become visible and opens formative feedback opportunities. It may also lead to further questions being asked, allowing the Inquire phase to start again.
When designing a teaching sequence, consider the diagnostic assessment that was undertaken during the Launch phase. Consider if alternative conceptions could be used as a jumping off point to discussions. How could students represent their learning in a way that would support formative feedback opportunities? Could small summative assessment occur at different stages in the teaching sequence?
Read more about using the LIA FrameworkUsing secondary data
(Slide 20) Discuss the advantages and disadvantages of using secondary data.
- What is secondary data?
- Data collected by someone else at an earlier time.
- How do we know if we can trust the secondary data? What things do we look for?
- We need to know how the data was collected, if there were any controls, has the data been checked by other scientists.
- Where did this data come from?
- From a peer-reviewed journal. The journal details are listed next to the data.
- What does ‘peer-reviewed’ mean?
- The information in the article has been checked by expert scientists in their field.
- Why is peer-reviewed data more reliable?
- Because it has been checked by another scientist who is an expert in that area.
- What claims can we make about this data? What plant has the most/least waste matter?
- What do we normally do with waste matter on Earth? How can we recycle the waste matter?
- Most food waste goes into compost where bacteria and fungi decompose it and turn it into soil and fertiliser. Matter is recycled.
- Why can’t astronauts do the same thing with their waste?
- For health reasons, astronauts cannot have anything decomposing on the ISS. It would contaminate the air with fungi or bacteria, as well as produce carbon dioxide.
✎ STUDENT NOTES: Complete Selecting plants Resource sheet.
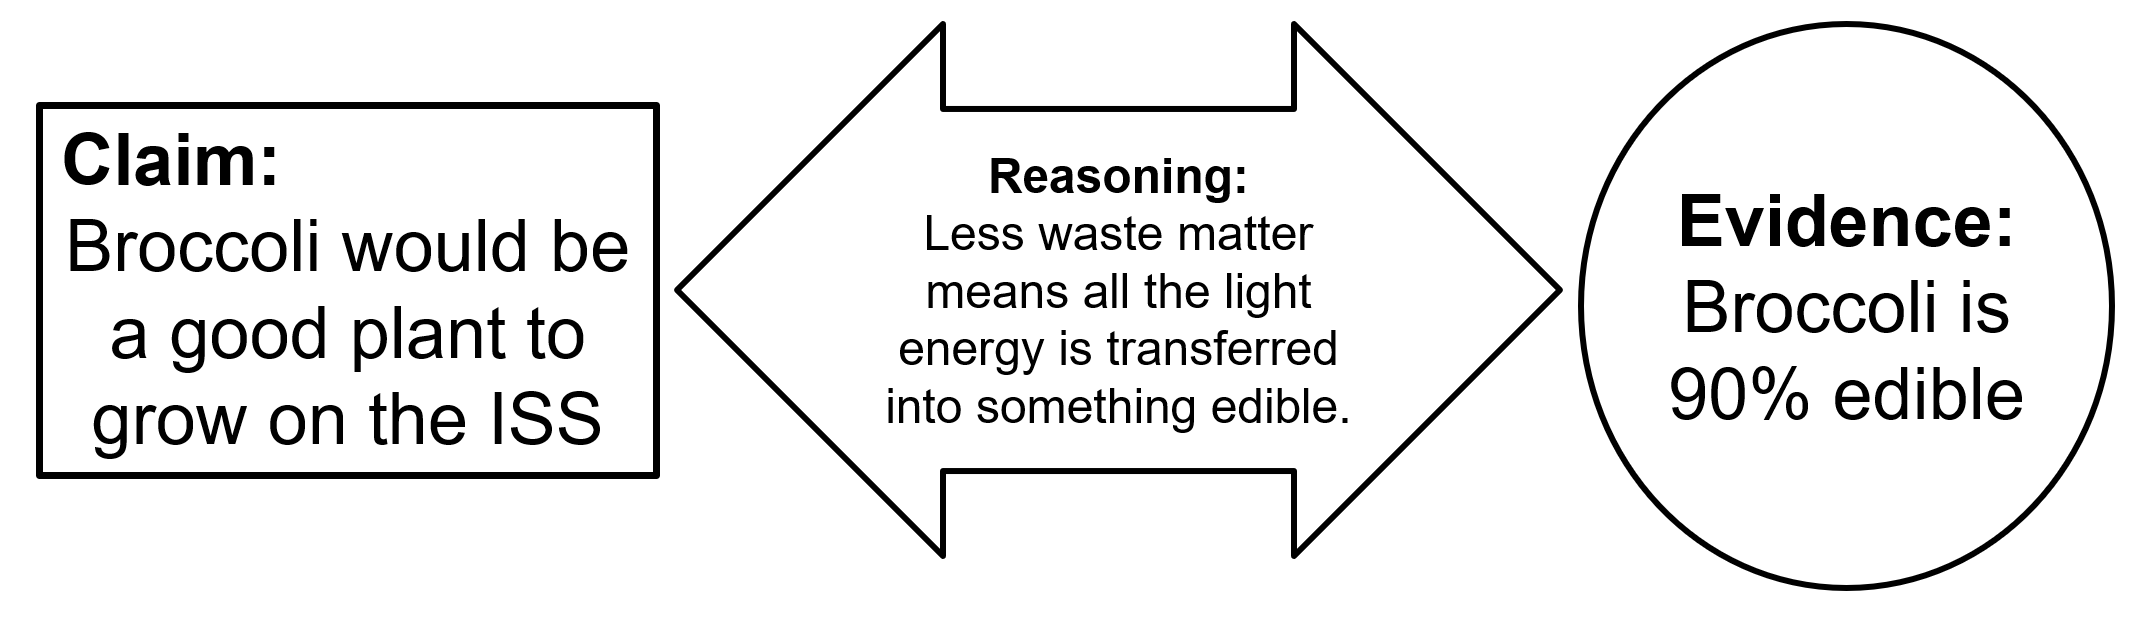
Encourage students to make a claim that identifies the best or worst plants to grow on the ISS. Guide students to use evidence from their graphs (or prior experience with the plants, such as plant height) to support their claim. Reasoning links the evidence with the claim.
Compare students’ claims against the criteria decided early in the lesson.
Discuss the foods that form diets from different parts of the world (including First Nations Australians). Encourage students to consider how all diets could be catered for.
- Does everyone eat the same foods?
- What did you have for dinner last night?
- Does everyone in this class eat/like the same food?
- Have you ever eaten something new or different at someone else's house?
- Think of the astronauts on the International Space Station. What countries do they come from?
- Russia, America, Canada, Japan, Belgium, Denmark, France, Germany, Italy, Holland, Norway, Spain, Sweden, Switzerland, UK, Australia.
- Do they all eat the same food?
- How does this affect the food that is prepared for the astronauts?
- How could we plan for this when growing food on the Moon or Mars?
Extension: Watch the video Space Plants – how they are adapting? (4:27).
Reflect on the lesson
You might:
- compare how energy is lost from the ISS through heat, but the water matter could be recycled if it could be done safely.
- research one of the selected plants to identify how long it takes to grow, to provide more evidence and reasoning for students’ claims.
Argumentation
Argumentation is the process of systematically providing reasoning to support a claim.
Argumentation is the process of systematically providing reasoning to support a claim. Unlike the commonly used negative term ‘argument’, argumentation involves developing a valid argument or persuasive idea.
At the simplest level, students should be able to provide a claim, evidence and reasoning.
More advanced students will be able to identify:
Limitations: This data was collected with plants grown on Earth.
Backing: The assumptions made in the data. For example, it is assumed that plants will grow in the same manner on Earth and in microgravity.
Counter-claim: An answer to alternative claims. For example, broccoli would be more filling than Swiss chard, and requires less space than wheat.